Dan Toma - YO3GGX - yo3ggx@gmail.com

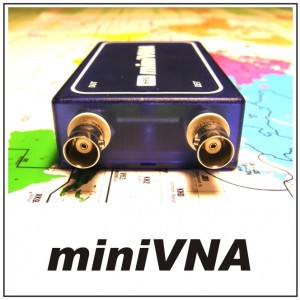
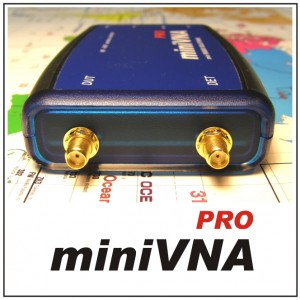
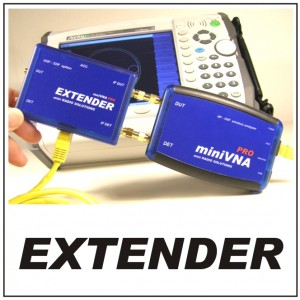
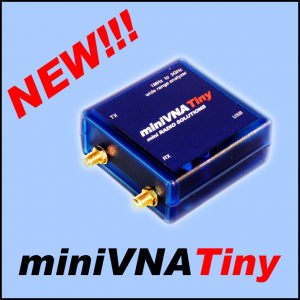
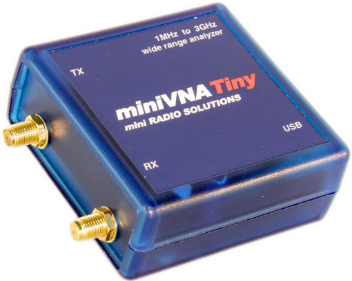
This is the User’s Guide for the Blue VNA Android only application to control Bluetooth enabled Antenna analyzers or VNAs (Vector Network Analyzers). Supported devices are the miniVNA, the miniVNA Pro Antenna Analyzers (with or without the matching Extender) and the new miniVNA Tiny, manufactured by: mRS mini Radio Solutions.
|
|
||||
|
|
|
The current version of the application has the following features:
Full control of the data acquisition from a miniVNA. If you have a standard miniVNA, then you can build your own Bluetooth interface based on the documentation available on my web site here ;
Support for miniVNA Extender that extends the range from 40 MHz to 1500 MHz;
Support for all Smartphones and Tablets with a resolution higher than 320x240, based on Android version 2.2 or later. Physically tested on Galaxy TAB 7.7 P6800, Sony Xperia ZL and Sony Xperia Mini ST15i and other resolution on an emulator;
Connects to any miniVNA type over Bluetooth, USB or Wi-Fi (to run on an Android emulator like BlueStacks and use of COM port redirector);
Custom frequency range selection started from a minimum of 1 KHz (without Extender) or 10 KHz (with Extender) up to full VNA frequency range;
Screen content is automatically adapted to the device resolution / dpi for optimum graphic details. There is no need to use “Stretch” mode for a larger display;
Configurable screen font size and grid transparency and aspect (dotted or dashed lines). Default font size is calculated based on current system font size and display size;
Display all the parameter values at the markers position (you can have one or two markers);
Auto calculation of the filters parameters;
Intuitive and wizard based calibration interface to simplify the calibration procedure;
Calibration data is saved in the configuration file for each mode (reflection/transmission/frequency) and for each VNA type (Standard, Pro or Pro with Extender), so there is no need to repeat the calibration procedure each time;
If no calibration data is available at startup, calibration procedure is initiated automatically;
Pairing with the Bluetooth device can be done directly from the application;
Offline mode support allows loading and/or saving vector data without connecting to a miniVNA. This mode can be used to interact with all the features available for both Standard and Pro VNA versions. Sample files are included for use in the app;
Internal Smartphone memory is used if no SD card is available;
Compatibility at file level with some Windows applications (i.e., Third party software: Zplots);
Demo capture file included to interact with the application even without a miniVNA;
Start button color displays current connection mode: BLUE – Bluetooth connected, GREEN – Wi-Fi connected, MAGENTA – USB connected, Orange – Offline mode;
Automatically enter Offline mode at startup if no connection available;
Export data in CSV, ZPLOT or S1P format;
Import data in CSV format;
Fast capture when in continuous mode (only 100 steps) for a higher speed and real time measurement;
Online help available from the application menu;
SM6ENG Audio mode for easy SWR tuning without looking at the screen;
miniVNA battery voltage indicator (only for miniVNA Pro);
Impedance scale zoom in 3 steps (1000, 500 and 100 ohms);
Frequency calibration data saved in the calibration file;
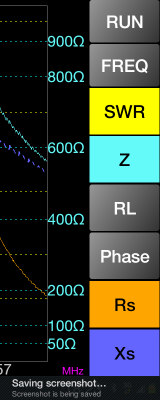
Save screenshots to the ‘exports’ folder through a simple gesture or a direct button (in some modes only);
Bluetooth automatically reconnects if connection dropped – feature removed from previous version;
Shortcut buttons for the main menu page;
Reflection (antenna) and Transmission modes support with the following features:
Gesture (Multi Touch) support for horizontal zoom and frequency shift without a new data capture;
Parameters that can be measured : SWR, |Z|, Return Loss, Phase, Rs, |Xs| for miniVNA and signed Xs for miniVNA Pro;
Display capture data in 2-axis graphs or Smith diagram;
Select one of the predefined bands (all HAM bands), HF (0.1 – 30 MHz), or a custom frequency interval (anywhere between the frequency range of the connected analyzer);
Select parameters to display (using different colors);
On screen marker can be activated / deactivated and freely moved by dragging it around the screen;
Display all the parameter values at the marker position (only the ones you manually selected);
Toggle display of all the selected parameters for the frequency with the minimum SWR in the selected frequency range displayed. Option to make this box full screen for a better visibility when outside tuning an antenna;
Frequency generator mode with the following features:
2 independent channels (for miniVNA Pro) or 1 channel (for miniVNA standard);
Independent attenuator control for each channel (from -60 dB to 0 dB), only for miniVNA Pro;
Adjustable phase difference between the channels (0-180 degrees);
Large DIGITS;
Extremely easy and intuitive operation, even with small screen devices;
Option to manually enter the frequency through the numeric keypad;
Work in manual frequency set or continuous (Live) mode;
Rotary knob added to change parameters in both manual and Live modes. The knob provides acceleration;
Sweeper mode (sweep a frequency interval in a specified amount of time);
Frequency calibration can be done in a very intuitive mode from Generator mode.
Cable data mode with the following features:
Large display objects;
Extremely easy and intuitive operation, even with small screen devices;
Automatic calculation for Phase and Loss background control graphs;
Connect the cable to be measured at the DUT connector with the other end open;
Table of well-known coax cables and their Velocity Factors is included;
Measure and calculate cable length from less than 1 meter to hundreds of meters;
Cable length is measured in 2 steps, for better precision (second step reduces the frequency interval);
Measurements in units of meters or feet;
Measure cable loss for frequencies from 0.1 To 180/200 MHz;
Operates in Offline mode, if the cable was measured before and data saved in a file.
X-tal EXPERIMENTAL mode with the following features:
Manual or auto measurement (you can enter the marked frequency to speed up the measurement);
Measure resonance frequency, Rs (at resonance) and Q;
The current version of the application has the following limitations:
Supports only one manufacturer, mRS mini Radio Solutions;
Can import only CSV files in a specific format (or exported from the application).
WARNING!!!
Use this application on your own risk. Do not expose the miniVNA or Extender to high RF fields. I cannot be held responsible for any damage caused to your VNA and/or Android device.
Download and install the current version of the application from the Google Play Store onto your Android device. Search for the name “Blue VNA” or use the link from the top of this document.
If you have installed an older version of the application (0.1 to 0.4), please remove it before installing the new version. The new version has some changes in the structure, so if the previous version is not uninstalled, you will have two versions installed at the same time. There is no need to uninstall the previous version if it is greater than 0.4.
The application can start in two modes, depending on the selected connection mode:
Run the application (named Blue VNA) with the following icon if you intend to use Bluetooth, Wi-Fi or the offline mode;
Plug the miniVNA into the OTG USB cable. If the Android smartphone/tablet is able to power the miniVNA, then from the prompt, select the application to run each time when plugging in that device. Note, see OTG USB power specifications for device compatibility.
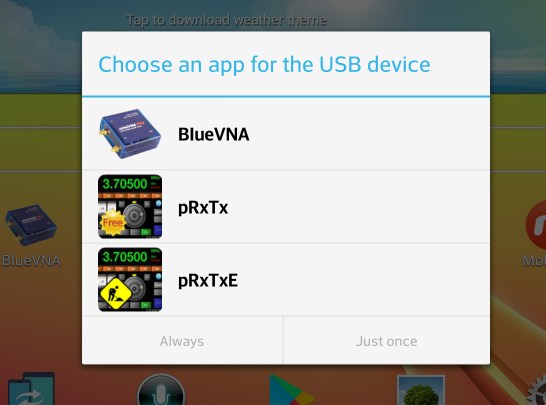
First, select BlueVNA. Select “Always” to automatically start the application each time. To be asked each time, select “Just once”. The application will be started automatically.
NOTE: Please keep in mind, not to start the application manually if you want to use USB mode.
If you start the application for the first time or after a configuration file reset, you will get the following startup page:
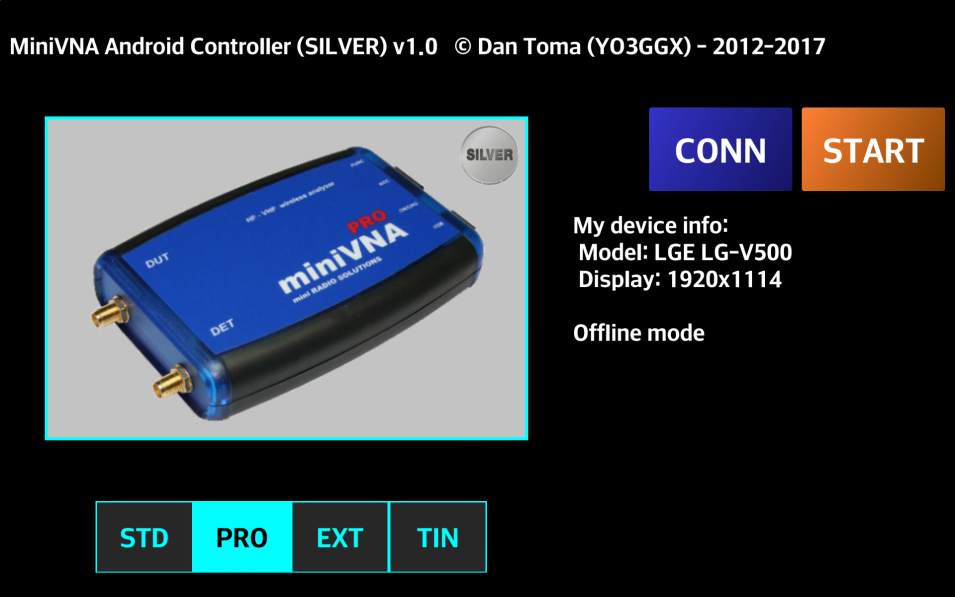
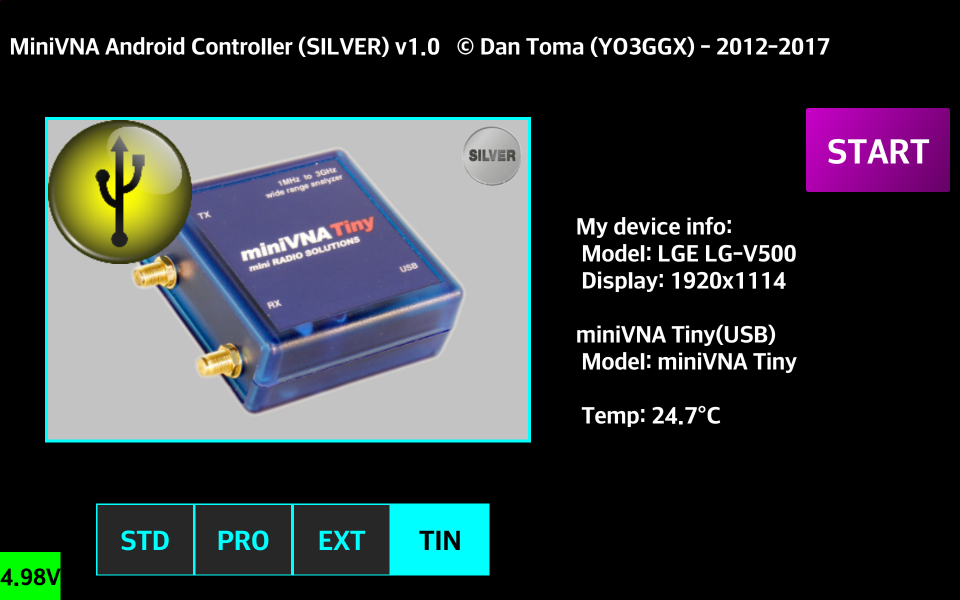
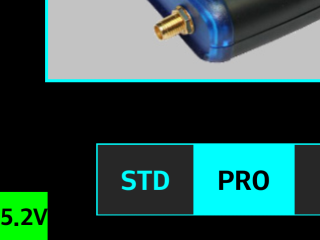
Select the type of device: miniVNA: MiniVNA standard, miniVNA Pro or miniVNA Pro with Extender. Select using a gesture by sliding the picture horizontally or directly press one of the buttons: STD, PRO or EXT. You will get one of the following screens:
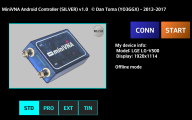

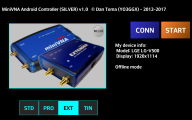

If you want to start application in Offline mode, press the “START” button.
Press the “CONN” button to connect to the miniVNA. The “CONN” button will disappear and depending on the connection the application will respond as follows:
USB Mode – connection will be established without any prompt;
Bluetooth or Wi-Fi modes –select between one of the two modes.
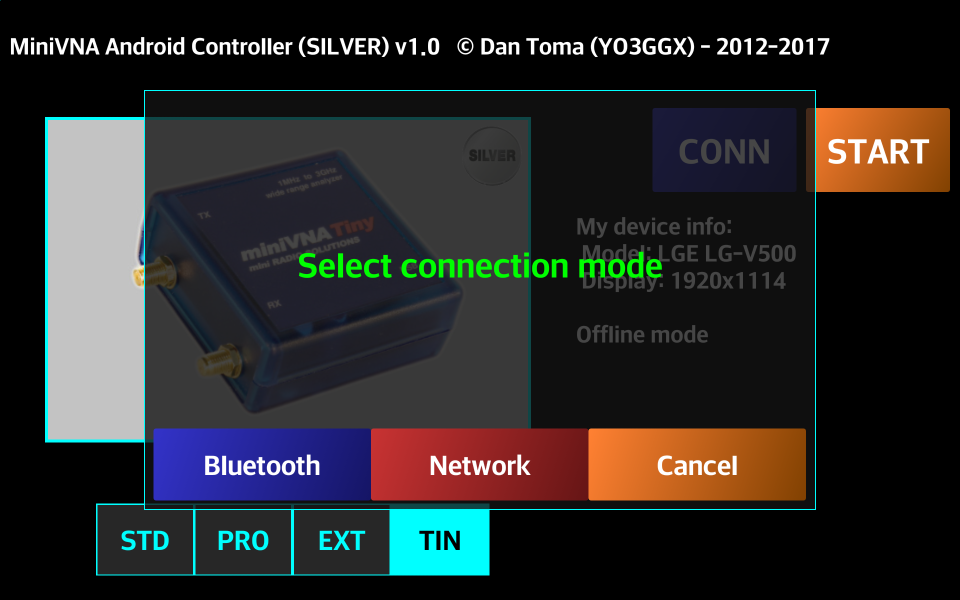
NOTE: To use Wi-Fi mode, the miniVNA must be equipped (as an add-on) with a Wi-Fi to serial interface or use a COM port redirector if installing this app inside an Android Emulator (like BlueStacks). The miniVNA’s Bluetooth is disabled when it is connected to a USB cable, even if the other end is not connected.
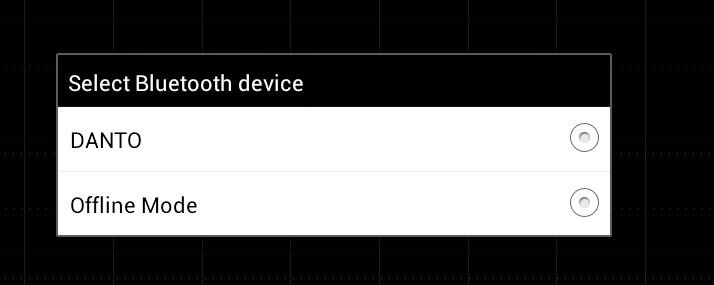
If using Bluetooth mode and Bluetooth is enabled on the Android smartphone/tablet, the application will start searching for nearby Bluetooth devices…
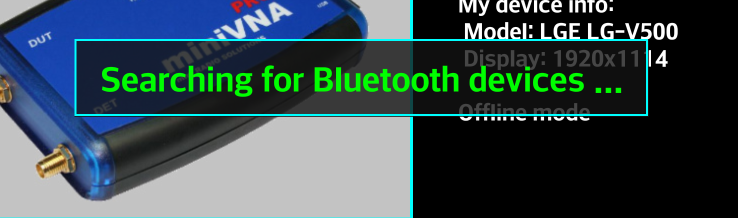
…in a few seconds, the display will list available nearby Bluetooth devices.
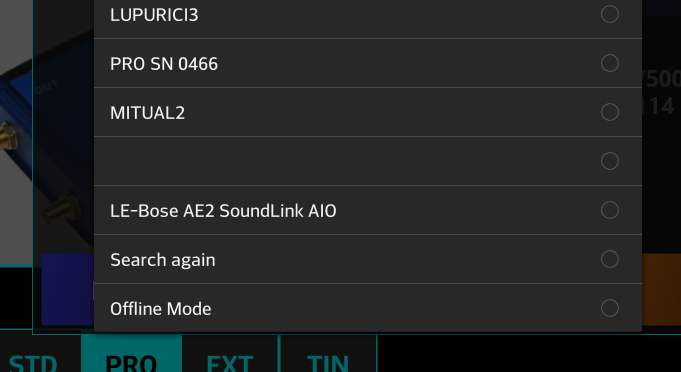
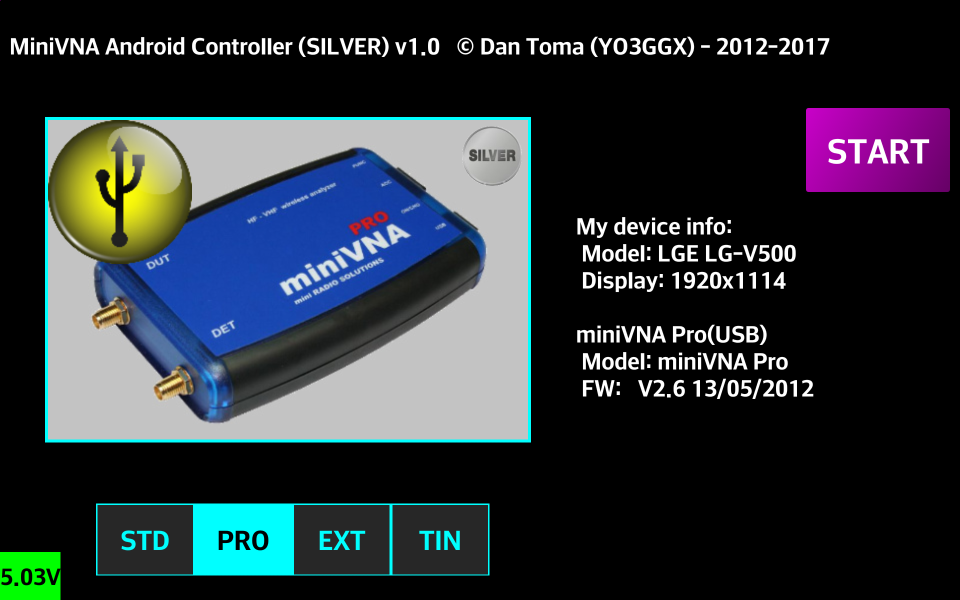
Select your miniVNA from the list (PRO SN 0466 in the picture above) or Offline mode not to connect to the miniVNA. The connection will be established, the background of “START” button goes blue and the Bluetooth symbol will be displayed in the top left corner of the miniVNA “START” screen.
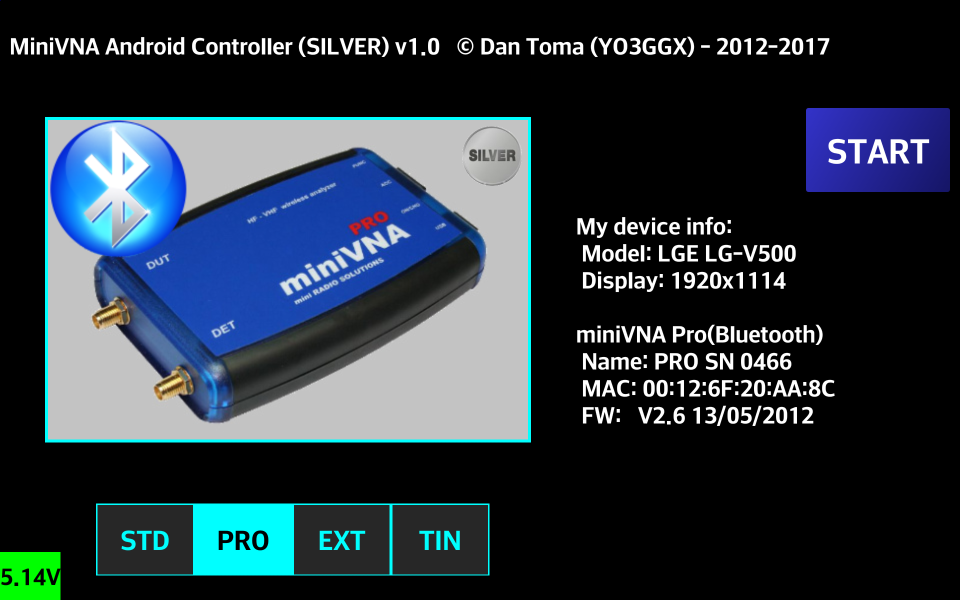
For miniVNA Pro, firmware version will be displayed, together with the battery voltage in the lower left corner. In Tiny case, current battery voltage and internal temperature is displayed.
The battery voltage background color will change to yellow when low level and to red when critical. When red, recharging the miniVNA battery is mandatory to prevent battery damage. If your analyzer use an external power, the displayed voltage can be even over 5V.
If Bluetooth is not started, a prompt will appear to start turn on Bluetooth.
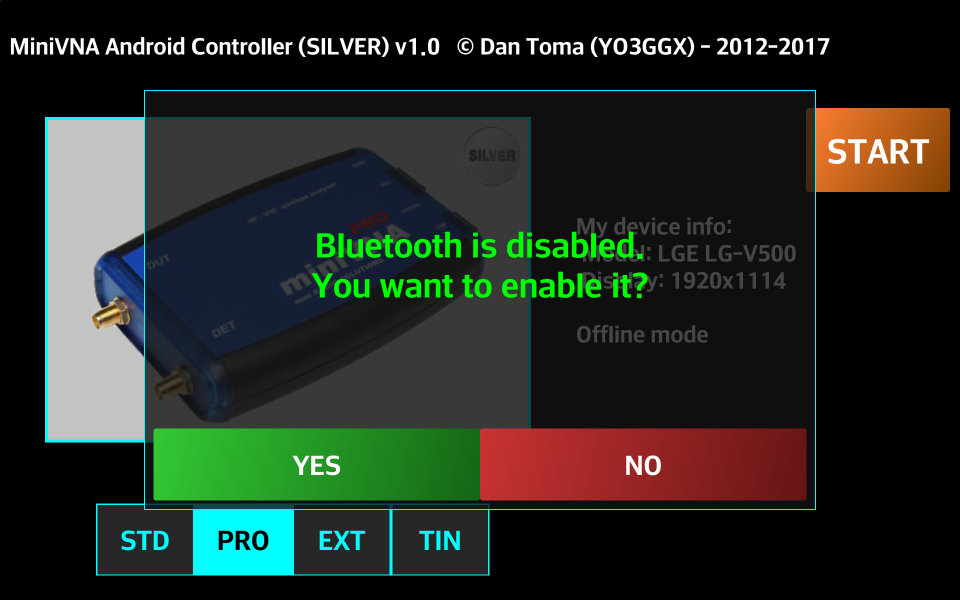
Press “Yes”, if you want to enable Bluetooth and search for the device or “No” to use “Offline” mode.
If Wi-Fi mode (if available on your miniVNA through a third-party module) is selected, then a prompt for the IP address and port used by your miniVNA will appear.
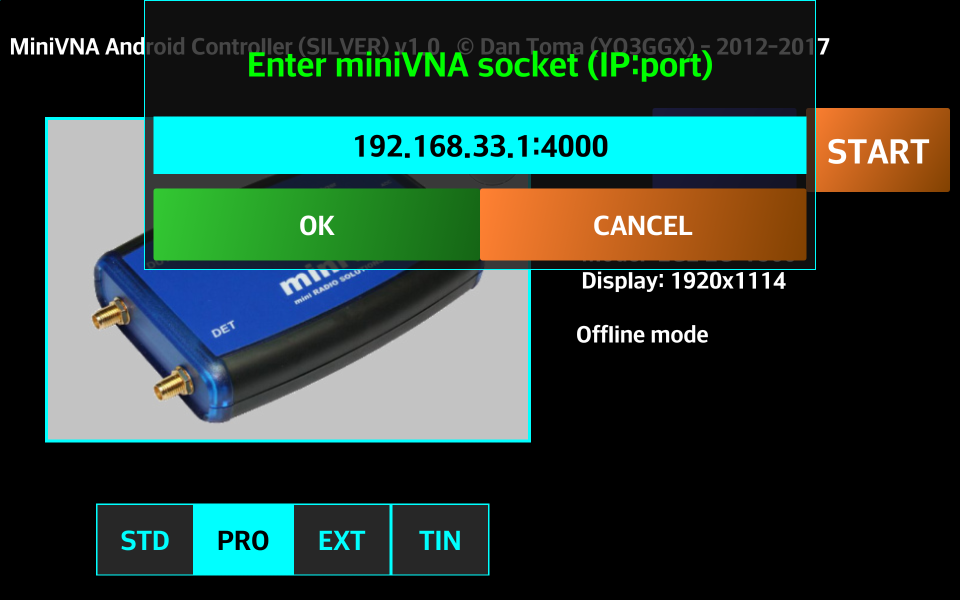
Enter the data in the format IPaddr:port and then press OK. Connection will be established automatically, “START” button background will go green and the Wi-Fi symbol will be displayed in the top left corner of the miniVNA START screen.
This is an example on how the symbol in the upper left part of the miniVNA picture will represent the connection mode (USB, Bluetooth or Wi-Fi for a miniVNA standard connected through USB:
The symbol and “START” button color will change as follows:
|
Symbol |
Connection mode |
START button color |
|
|
miniVNA connected over USB |
Magenta |
|
|
miniVNA connected over Bluetooth |
Blue |
|
|
miniVNA connected over Wi-Fi |
Green |
|
No symbol |
Offline mode |
Cyan |
In the right part of the screen, information about your Android device and connected miniVNA (if any) is displayed. This can be useful to help me debug the application if an error occurs.
NOTE: Please write the information or save a screenshot of the startup screen and send it to me by email or post it on the Blue VNA Application Forum if you have a support request.
If for some reason you want to reset the connection mode or to completely reinitialize the configuration file to fix data corruption, long press on the “START” button. Select between “Connections” (only) or “Everything” (a full reset).
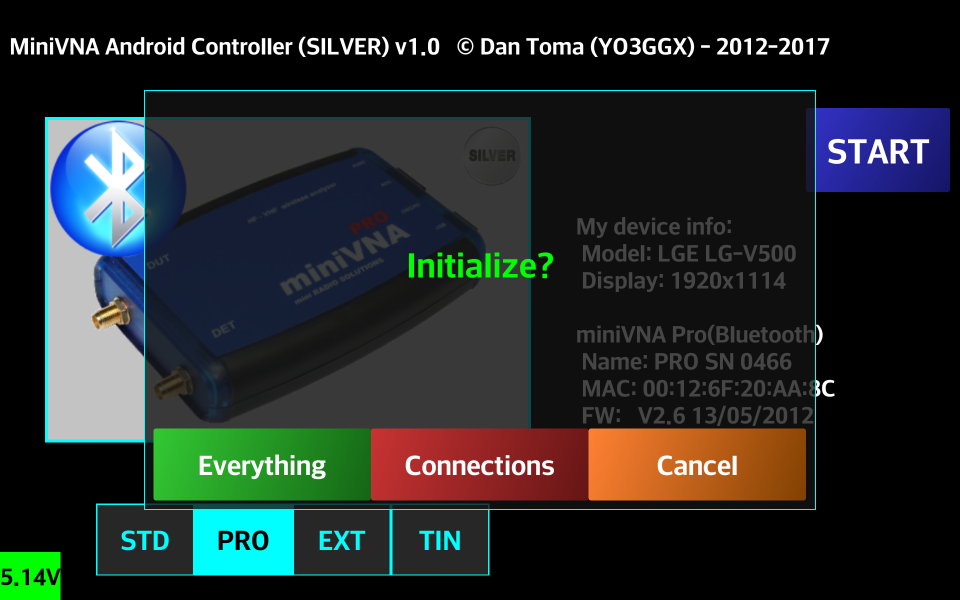
The blue “CONN” button will again be displayed in both cases and select the option to change the device or connection mode. To start using the application in the current mode, press the “START” button.
From now on, the application will behave in the same way for all connection modes: USB, Bluetooth or Wi-Fi. Next time the application starts, the “CONN” button will no longer be present and the last used connection will be automatically established. The only exception is in USB mode. If the application is automatically started when connected to the miniVNA over USB, the USB mode will be initiated no matter which mode was used in the previous session.
If running the application for the first time and no calibration data was previously saved, when pressing “START” you are forced to do a full calibration or to load it from a previously saved file.
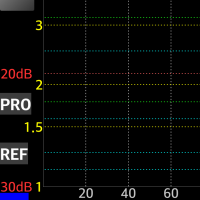
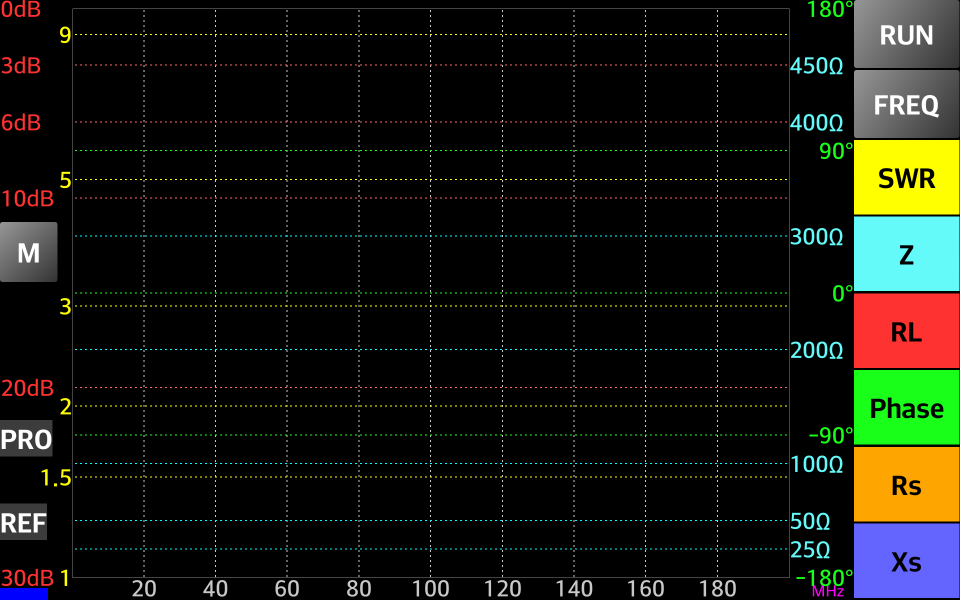
The grid looks different on different Android devices, depending on the display technology, quality or screen size. The graph grid can be adjusted according to your preferences. The grid transparency or the grid lines (between dotted or dashed can be adjusted);
If the calibration data was previously stored in the application configuration file, then immediately after pressing the “START” button on a blank graph, the grid can be configured.
NOTE: Only before any other operation (e.g., Capture, Calibration or File Load) can the grid be adjusted!
First, activate as a minimum, the buttons for: SWR, Z, RL and Phase, to display all the available horizontal grid lines.
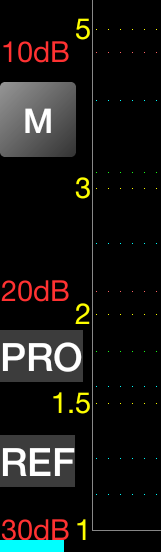
Then, slide one finger horizontally (gesture) to toggle between dots or dashed line as in the following pictures.
Slide one finger vertically in upper direction (gesture) to decrease grid transparency or lower to increase it. The new grid settings will be saved in the configuration file and will be used at each application start.
The application menu can be accessed in two ways:
Using the Android standard menu button (deprecated for Android 4 and up);
Using the “M” button inside the application.
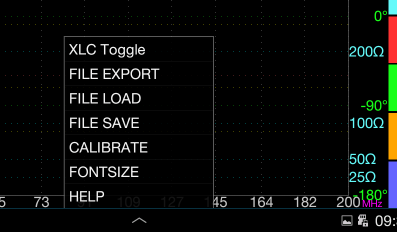
For the first option, when pressing the menu button in the taskbar, the main menu items will be displayed.

To see the rest of the menu press “More” in the right. NOTE: Some Androids display this differently.
To access the menu at any time from the main application window press the “M” button in the left part of the screen.
The main menu items will slide to the center of the screen as buttons shown below.
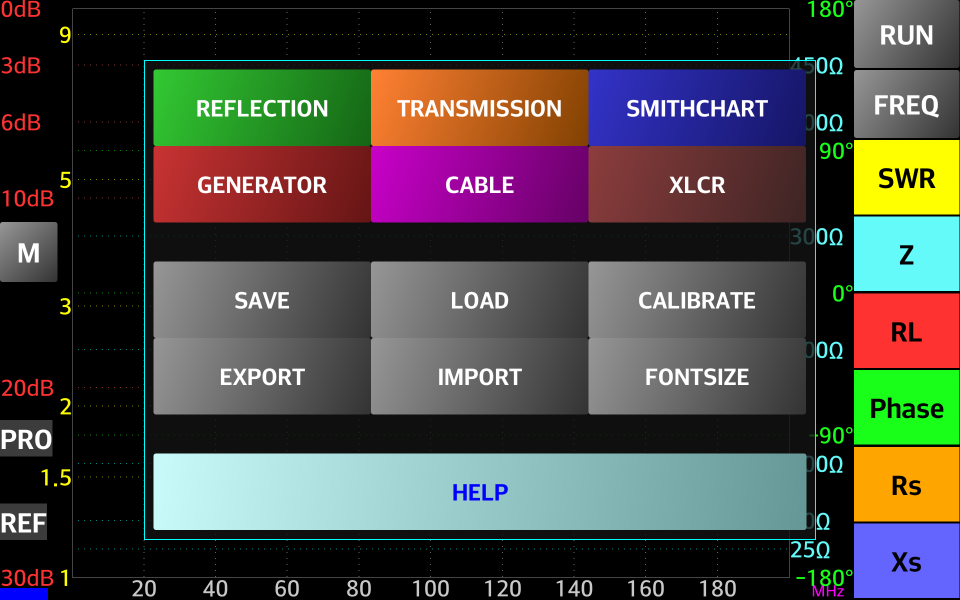
Click on the menu item to select and the buttons will disappear to the left in a short animation.
If using the application for the first time in any mode except Offline and no calibration data was previously saved, when pressing the “START” button, you are prompted to do a calibration or to load an existing calibration file. If you want to recalibrate at a later time, just click on the “CALIBRATE” button in the application menu.
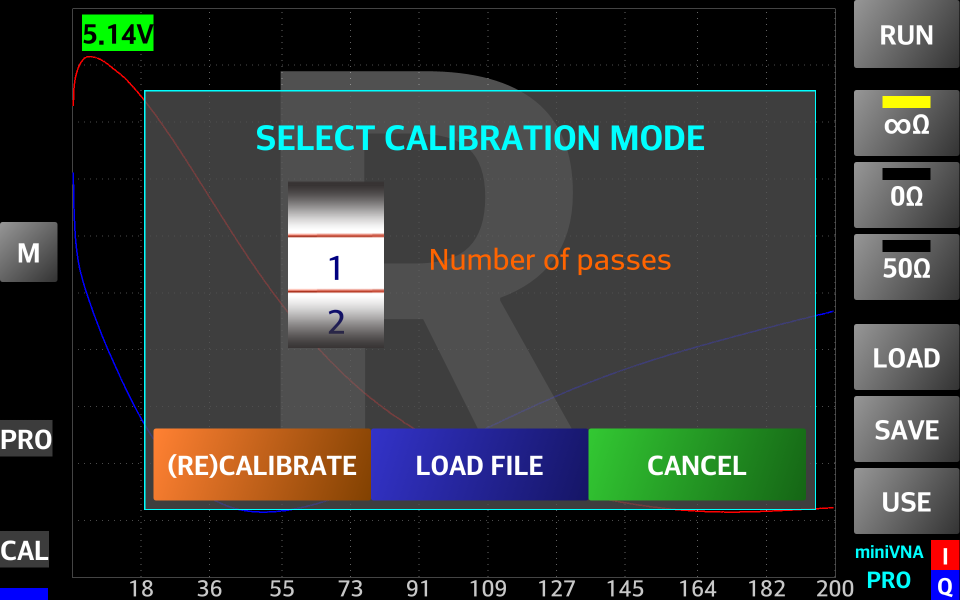
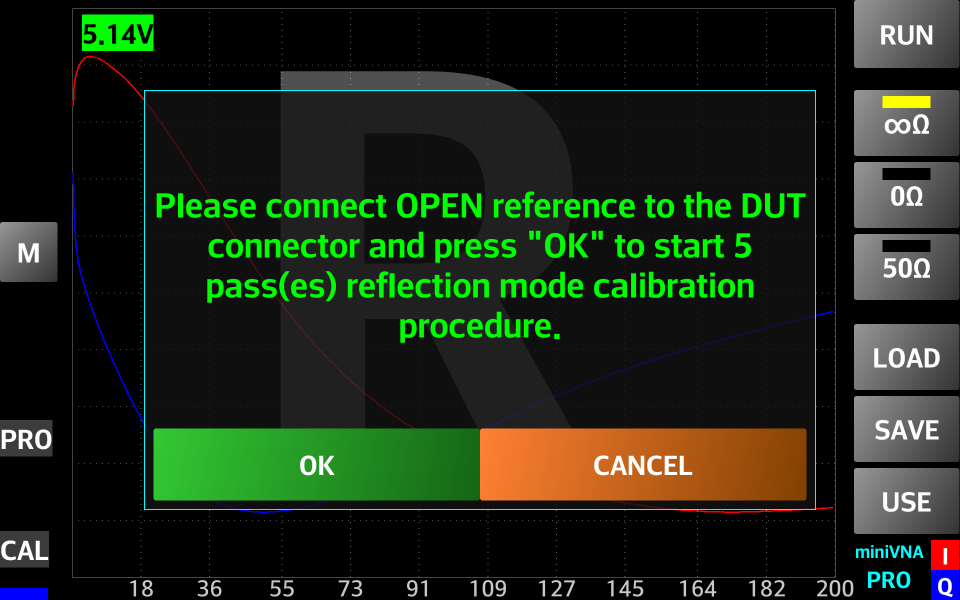
For a new calibration, select the number of passes (between 1 and 5) and press the “(RE)CALIBRATE” button using the thumb wheel. It is recommend to use the maximum value (5) for best results. In this way, 5 successive data captures will average the value calculated for each step. The inherent calibration noise will be highly attenuated. The calibration is done using 1000 steps (non user-configurable) with interpolation for the intermediary values. For a new calibration, as indicated on the display in the following picture, connect the OPEN calibration reference to the DUT connector (or leave both connectors open for miniVNA standard) and then press the “OK” button.
NOTE: The calibration references should be connected with only finger strength tightness, firm, not too tight and not loose. No tools should be used to connect or remove the calibration references.
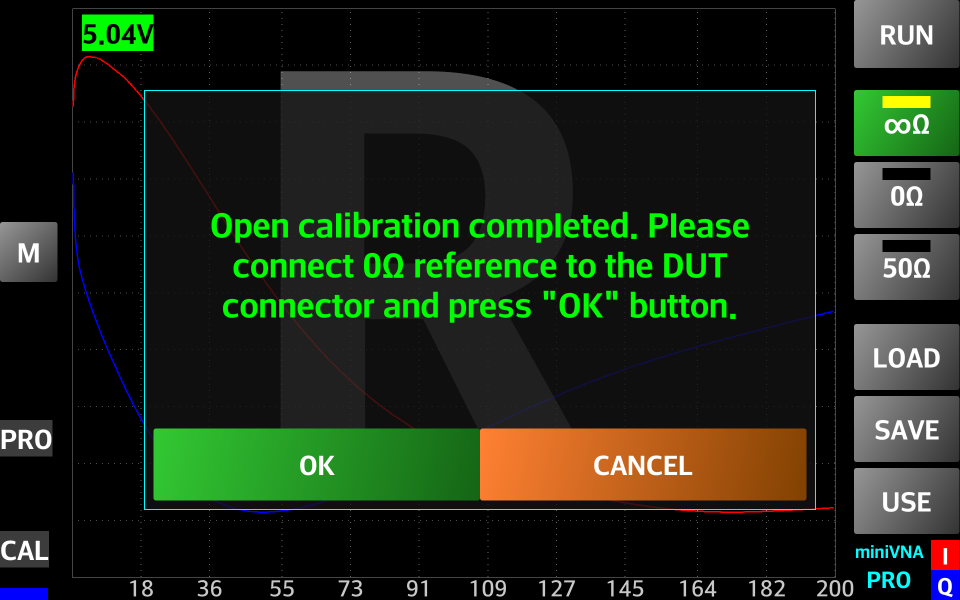
A progress message will be displayed. When the OPEN calibration is completed, remove the OPEN calibration reference from the DUT connector. For the miniVNA Pro, connect the SHORT (0 ohm) calibration reference to the DUT connector as shown in the following picture and press the “OK” button again.
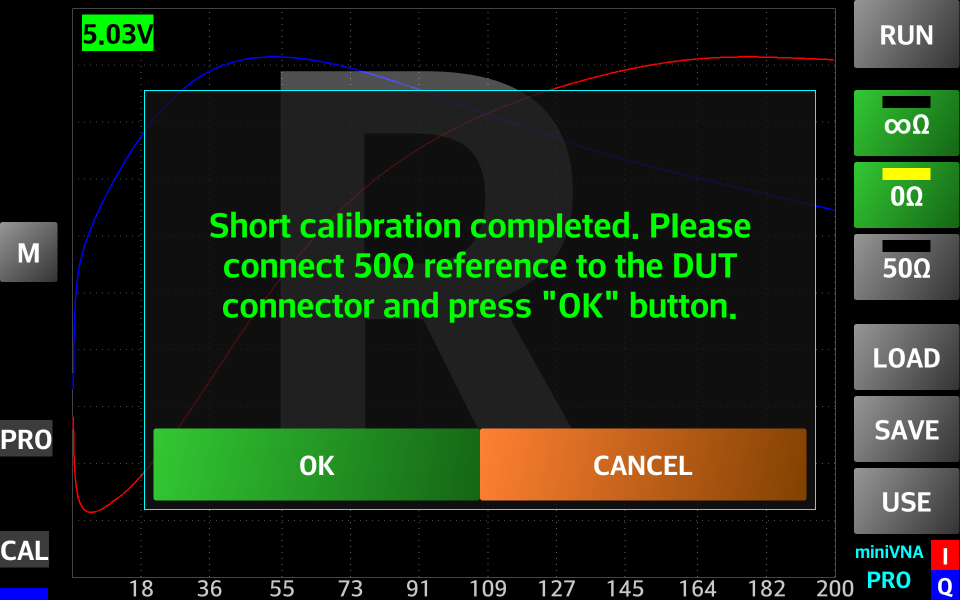
A progress message will be displayed. When the SHORT calibration is completed, remove the SHORT calibration reference from the DUT connector. Then, connect the LOAD (50 ohm) calibration reference to the DUT connector as shown in the following picture and press the “OK” button again.”
A progress message will be displayed. When the reflection mode calibration is completed as shown in the picture below, remove the LOAD calibration reference from the DUT connector.
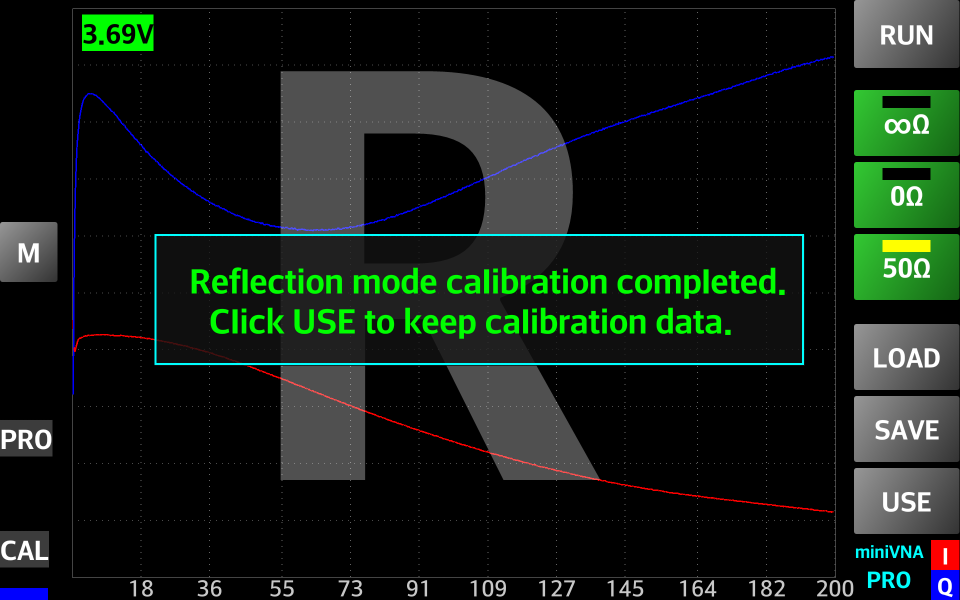
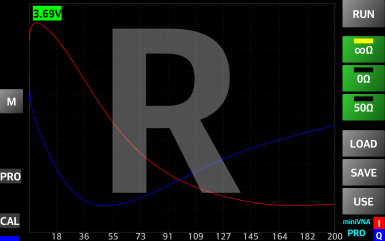
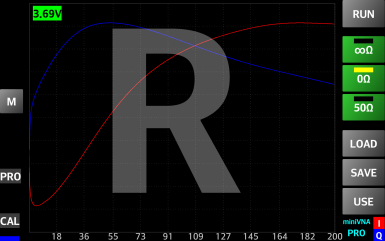
If all 3 steps completed okay, the corresponding buttons on the right side will change to green. In turn, press each of these buttons to see the calibration graphs for OPEN, SHORT and LOAD, which looks like the graphs in the following pictures (i.e., for miniVNA Pro). The large “R” in the background shows the miniVNA is in the reflection calibration mode.
OPEN calibration SHORT calibration LOAD calibration

Optionally, but strongly recommended, save the calibration data in a file. For this purpose press the “SAVE” button. A window will be displayed with the list of available calibration files.
Press inside the cyan text entry box to open the virtual keyboard and then enter a name for your file without an extension.
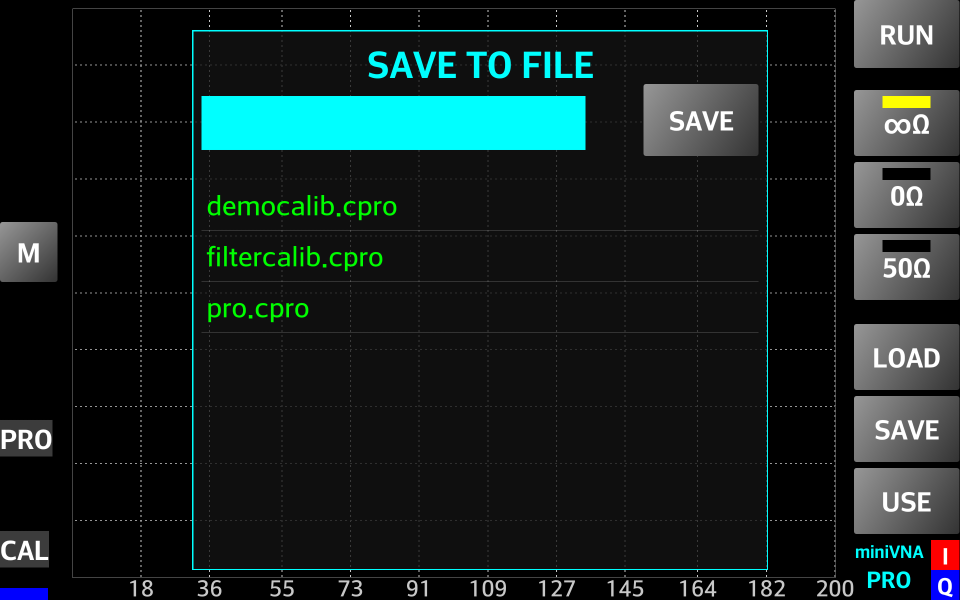
When ready, press the “SAVE” button to save the file. A confirmation that the file was saved successfully will be displayed. To cancel the action, long press the “SAVE” button or slide the top of the box to the right (gesture) to make the window box disappear.
In the application, you have some demo calibration files included, named “democalib.xxx”, where xxx = ‘pro’ for miniVNA PRO, ‘tin’ for miniVNA Tiny or ‘std’ for miniVNA Standard. This can be used even in Offline mode, if you don’t have (yet) a miniVNA device and you want to play with the application features.
To load a previous saved calibration file, press the “LOAD” button, a list of available calibration files for your miniVNA model (if any) will be displayed.
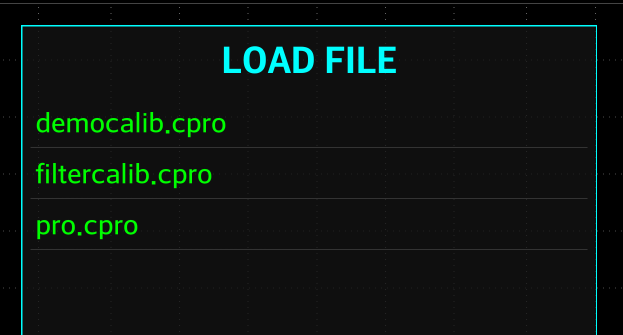
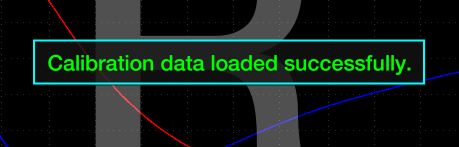
Press the calibration file to load and a confirmation message that the calibration data was successfully loaded.
To cancel the operation, slide to the right the top of the box (Gesture) to make the display box disappear.
NOTE: The frequency calibration data can be added later, if you save (again) the file after a frequency calibration is performed.
To save the calibration data in the configuration file and start measuring, press the “USE” button. This will transfer operation to the Reflection mode screen. See Using Reflection Mode chapter on how to use this mode.
After the reflection calibration, go to Transmission mode by selecting “TRANSMISSION” through the application menu. See Using the Application Menu chapter. If no transmission calibration was performed before, a prompt will appear to do it now through the same wizard as in Reflection Calibration mode.
First, connect the OPEN reference to the DET connector and press the “OK” button as shown below. Reminder: Use only finger strength tightness to make connections.
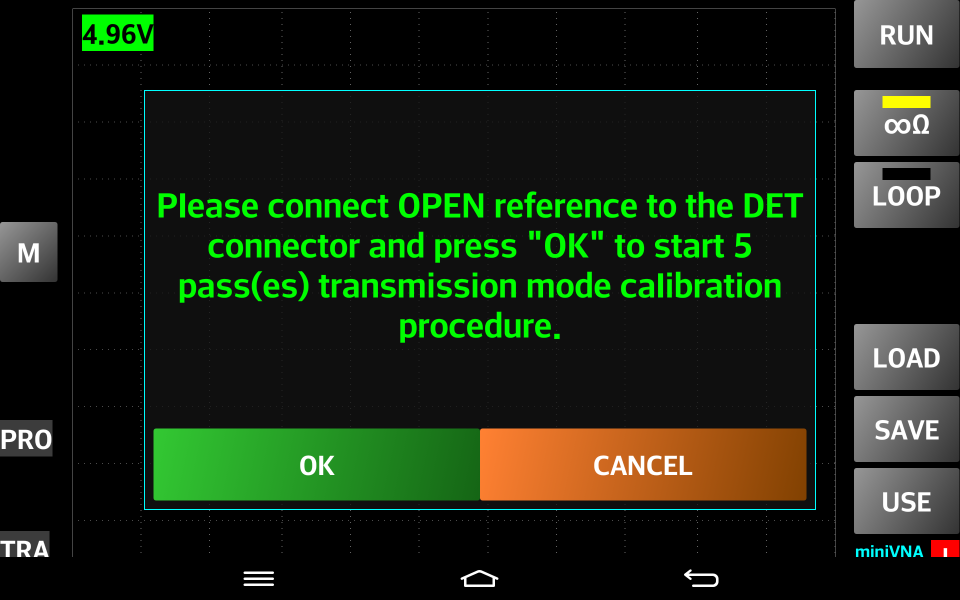
When completed, remove the OPEN reference from the DUT connector.
Then, connect a short 50 ohm cable between the DUT and DET connectors and press the “OK” button as shown below.
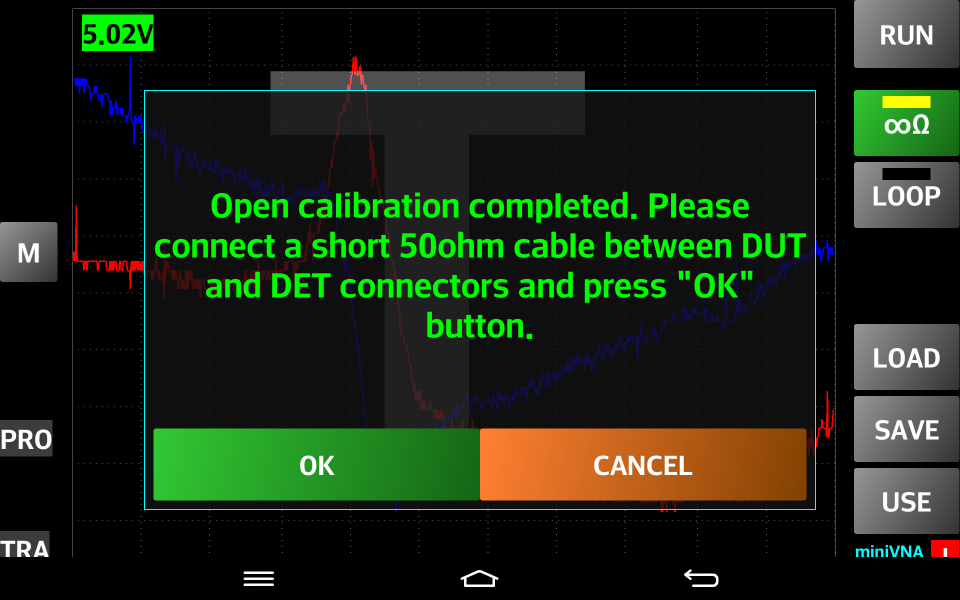
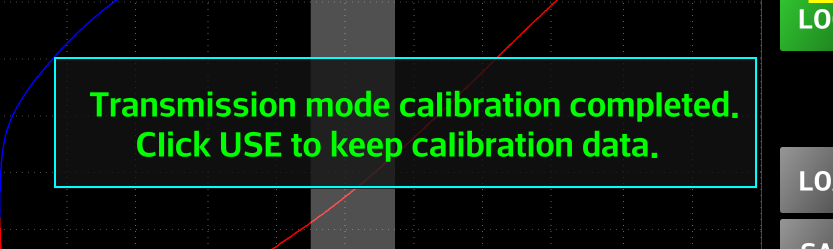
When completed, a confirmation message that the transmission calibration data was captured successfully as shown below. Press the “OK” button to hide the message. The two virtual LED buttons, under the “RUN” button, will become green to indicate that both OPEN and LOOP calibration were performed and a completed message is displayed as shown below.
Like in the Reflection Calibration mode, it is highly recommended to save/load calibration data in a file.
The graphs for the two calibration steps are shown by pressing the corresponding button. The graphs must look similar (not exact) with those presented in the following images (based on specific devices tolerances).
OPEN calibration LOOP calibration
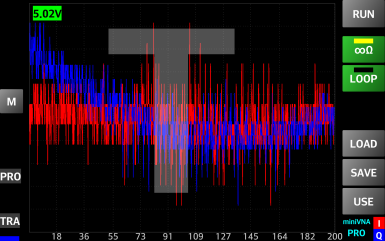
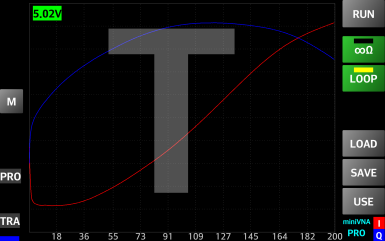
NOTE: For both Reflection and Transmission Calibration, the vertical scale of the graph is in relative units, with no other meaning. The graph uses auto scale to better represent the trend which must be similar for miniVNAs of the same model.
The next step is to press the “USE” button to save the Transmission calibration data in the configuration file and return to the Transmission mode.
You are now ready to use your device for “real life” data captures for Reflection and Transmission modes.
Frequency calibration is not too important for the Reflection and Transmission modes, so skip it for the moment.
A similar calibration procedure applies for the miniVNA Standard, but some of the steps are not available on the standard version. If using the Extender, the same procedure applies. See the note below.
NOTE: Separate calibrations are required with and without the Extender. In order to prevent a recalibration each time, the calibration data is saved separately in the configuration file. Save both calibrations in separate files, with a distinctive name. To load the calibration data after a reset, separately load it for Pro with and without extender modes. The application prevents loading the wrong calibration, so a prompt will be shown in case of error.
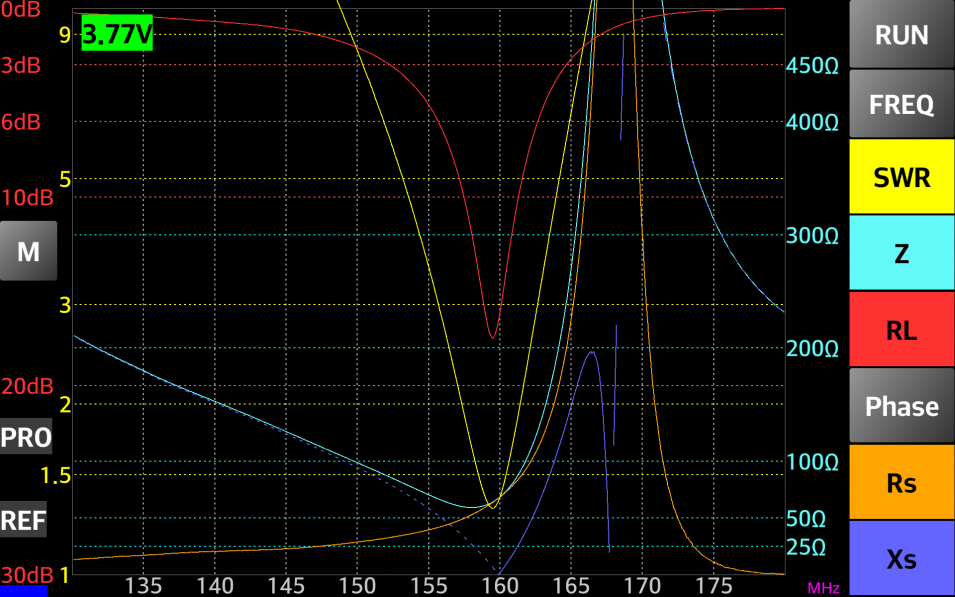
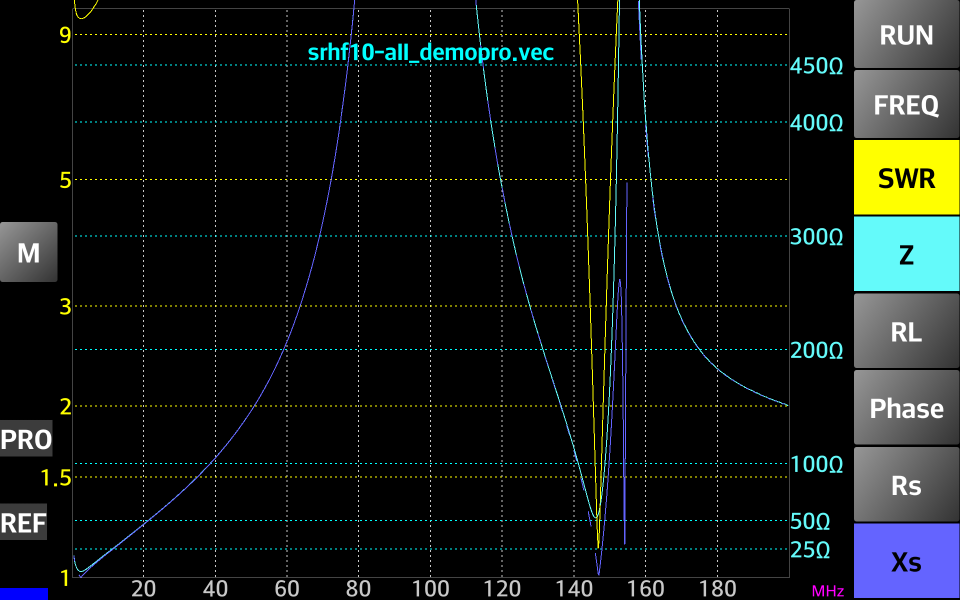
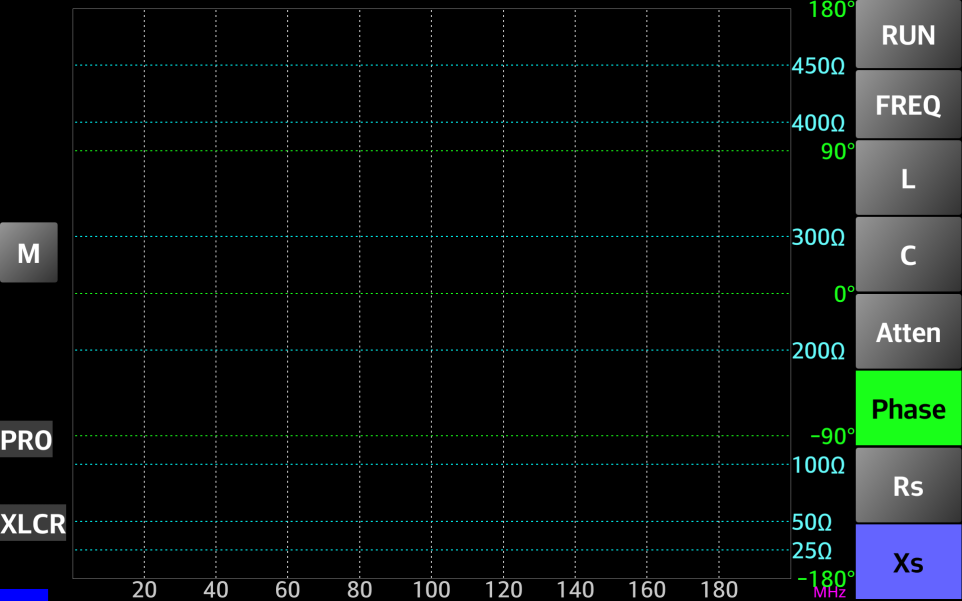
The screen will look like the following images for each respective mode:
Reflection mode Transmission mode
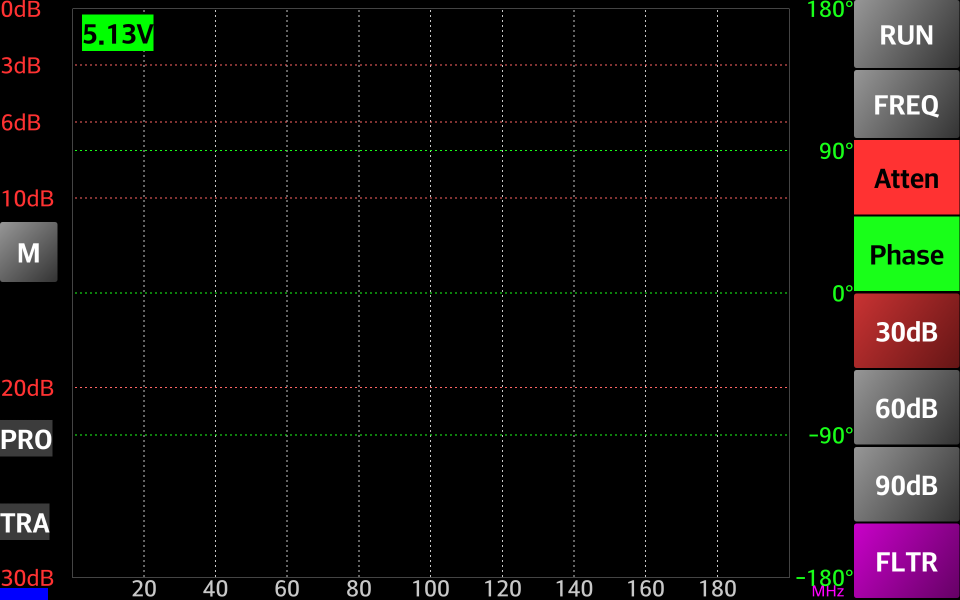
On the left side are the scales for SWR and Loss. On the right side are the scales for Z, Rs, Xs (all in ohms) and Phase (in degrees). Phase is between -180 and 180 for the miniVNA Pro and between 0 and 180 for the miniVNA standard. Xs has an absolute value for the miniVNA standard and a signed value for miniVNA Pro. Negative value for Xs is displayed as a dashed line on the graph.
After a data capture is completed, select which graph to display using the buttons on the right side of the screen.
In Transmission mode, only Loss and Phase graphs can be selected for display. The transmission loss scale can be automatically or manual selected (see later).
When the application is started for the first time, the full available range of frequencies is selected.
The frequency range can be changed by pressing on the “FREQ” button. A window will pop up allowing directly selection of one HAM band at a time, the full range or a custom frequency range.
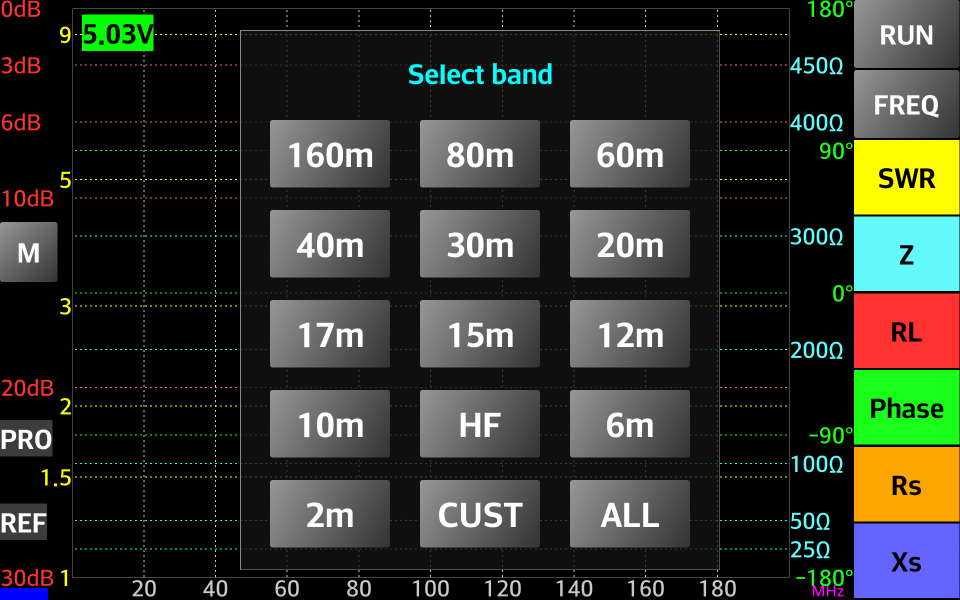
A long press on the “FREQ” button will reset to the full frequency range.
Long press on the “10m” button will select the CB (11 meter) band.
To enter a custom frequency range, press the “CUST” button. Another window will appear to change the minimum and maximum frequencies (in MHz).
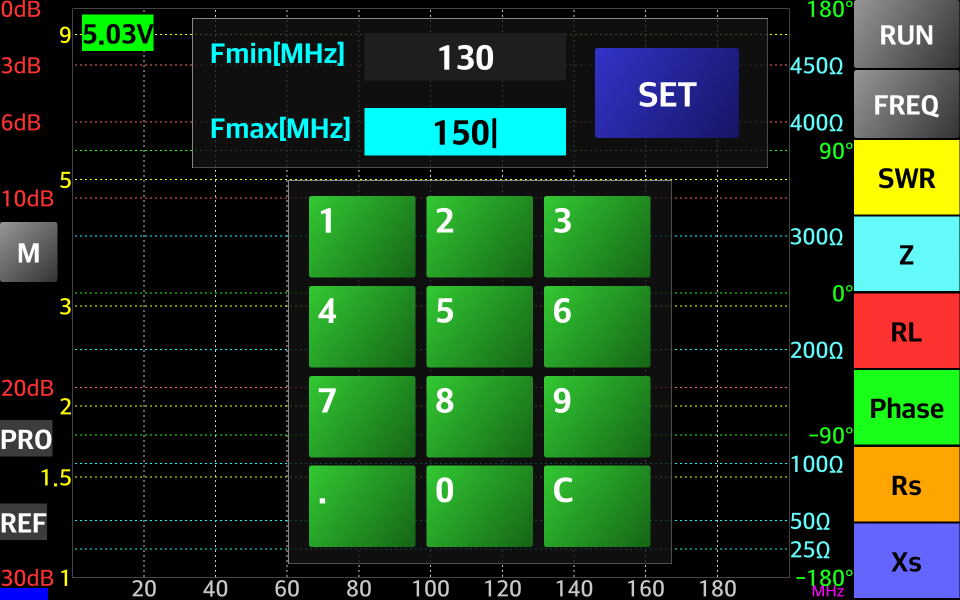
A short press on the “CLR” button will delete the last entered digit or long press to delete everything from that field.
When ready, short press the “SET” button to use that frequency range for the next data capture. To cancel the operation, long press the “SET” button.
The application font size is automatically set to an optimum value, independent on the system settings. However, to modify the font size, from the graphical menu or system extended menu (deprecated) select the “FONTSIZE” button. This can only be done in Reflection or Transmission mode. For the other modes an error message will appear:
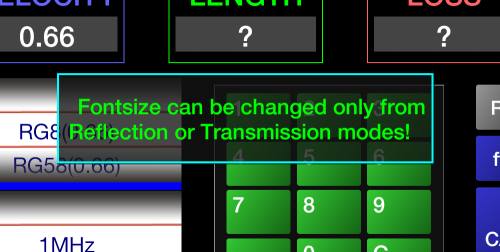
In the correct menu, a screen will be shown like the following:
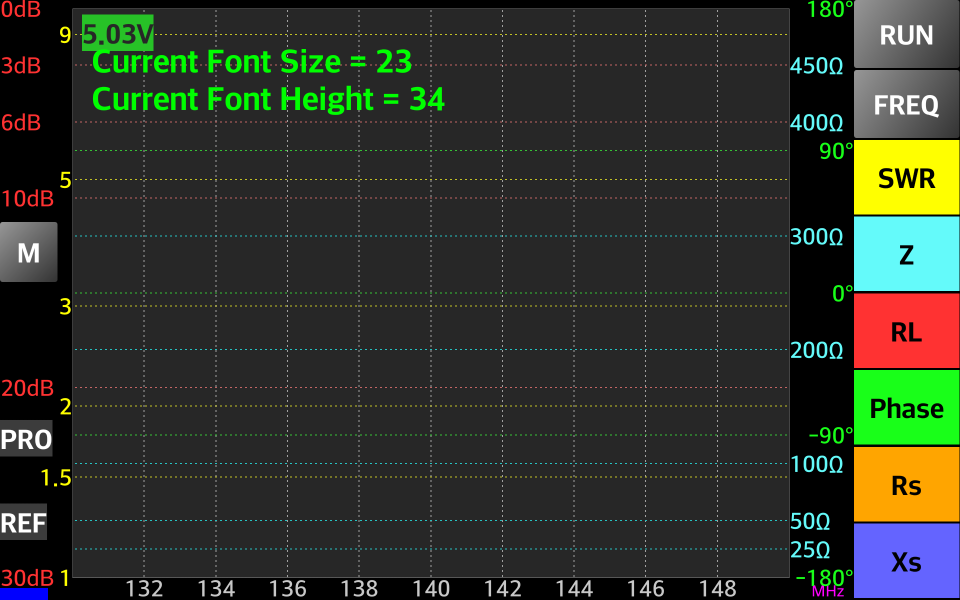
Slide one finger vertically (gesture) anywhere over the grayed zone (up or down) to increase or decrease the application font size. The new font size will be modified in real time, so choose the optimum size according to your preferences.
When ready, slide one finger horizontally (gesture) over the grayed zone to exit this mode through an animation. The new font size will be saved in the configuration file for further use.
At next start, the new font size value will be displayed in the information section of the startup screen.
Sometimes a recalibration for a specific mode is needed and you don’t want to use the wizard. Press on the “Cancel” button when prompted and select from corresponding button the type of calibration and then press the “RUN” button.
When ready, press the “USE” button to save the new calibration values in the configuration file.
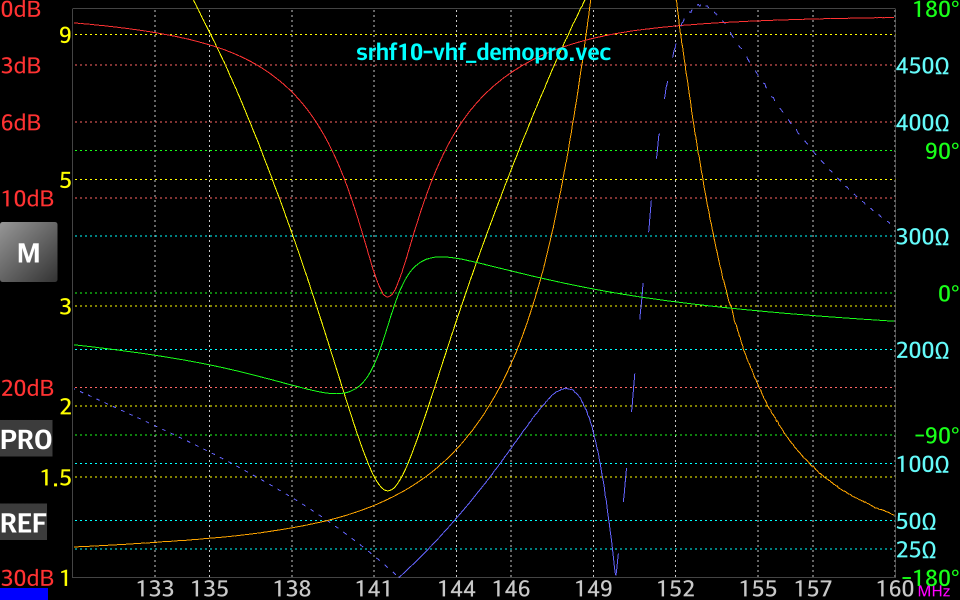
To start a data capture, short press on the “RUN” button. A standard data capture begins using 1000 steps and takes about 5 seconds to complete for a miniVNA Pro.
The “RUN” button becomes red during the data capture and then a short message will be displayed.
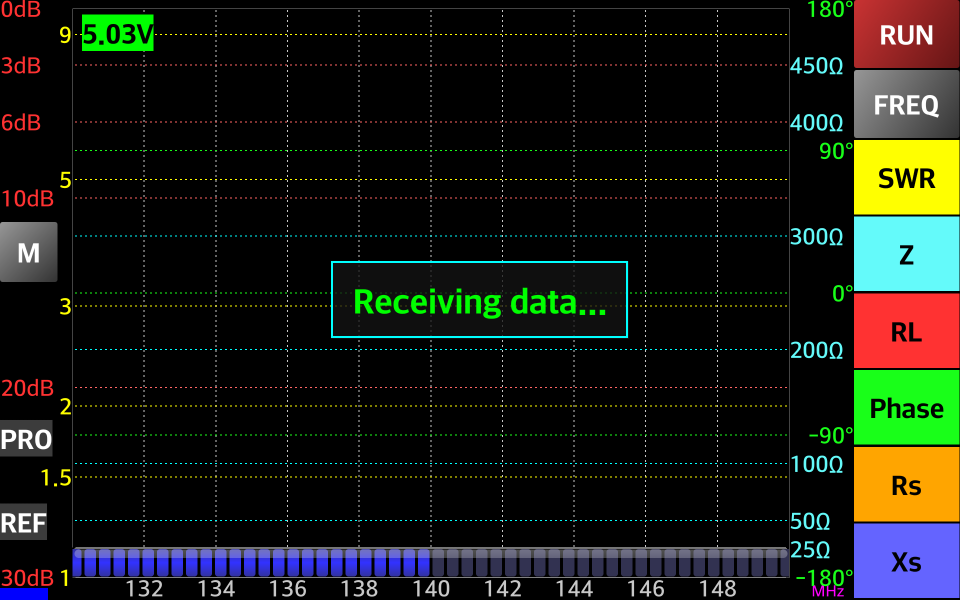
At the end of the data capture the “RUN” button will become gray again.
Long pressing the “RUN” button will start a continuous data capture. For a higher frequency sweep speed, in continuous mode only, the data capture is done with only 100 steps, enough for a rough estimation of the parameters.
The “RUN” button will remain red during the continuous data capture and the button name will change to “STOP.”
To stop the continuous data capture, press the “STOP” button. The graph will disappear for a few seconds and a full data capture will be completed automatically with (with 1000 steps).
NOTE: The same graph can be obtained in Offline mode, if the provided srhf10-vhf_demopro.vec file is loaded. This can be done through the FILE LOAD menu or by just pressing the “RUN” button when in Offline mode.
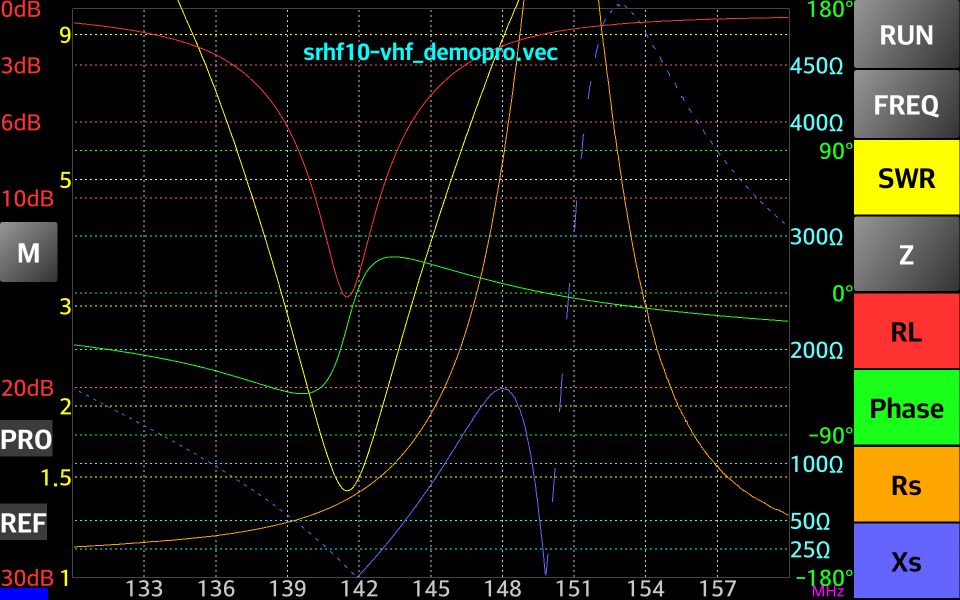
Press a button on the right side corresponding to a parameter to display on the graph. The corresponding graph will be displayed with the same color as the button.
Negative Xs values are displayed with a dashed line (only for miniVNA Pro or Tiny).
Slide one finger (gesture) vertically from the top to the middle of the screen to place a marker. The marker will be displayed in that position as a yellow dotted vertical line. A box will appear at the left lower corner. All selected parameter values will be displayed. The box can be moved anywhere on the screen by dragging it. The marker can be moved the same way.
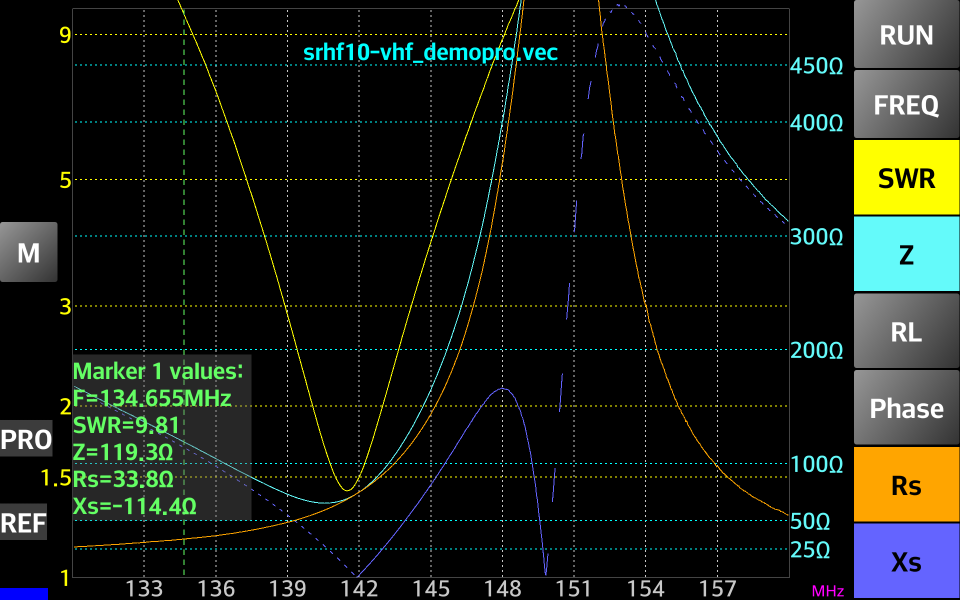
You can display a second marker using the same gesture, when one marker is already visible. The second marker will be displayed in red, including the corresponding values box.
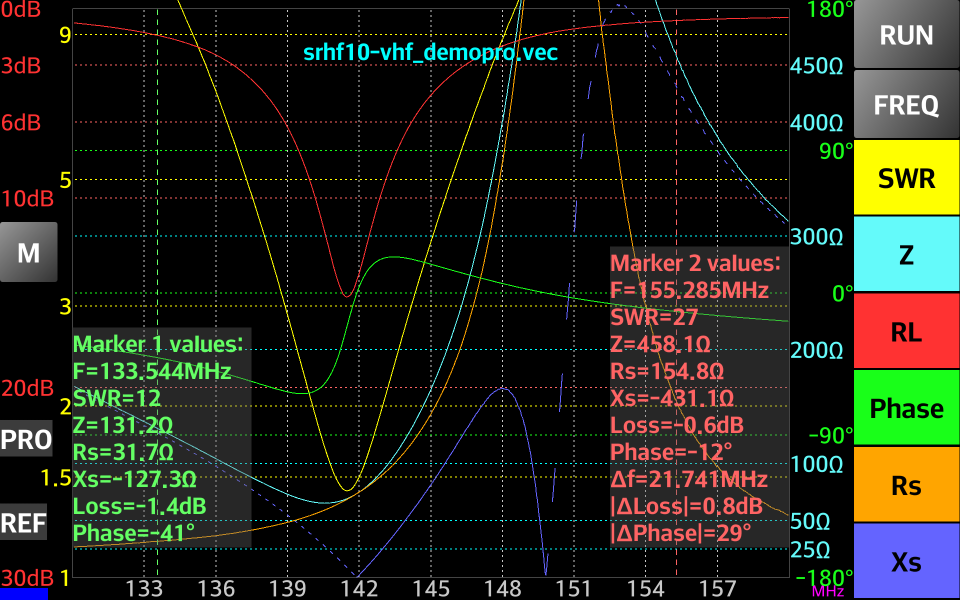
For the second marker, the difference is automatically calculated for frequency and for Loss or Phase (only of the respective parameter is selected using the corresponding button in the right).
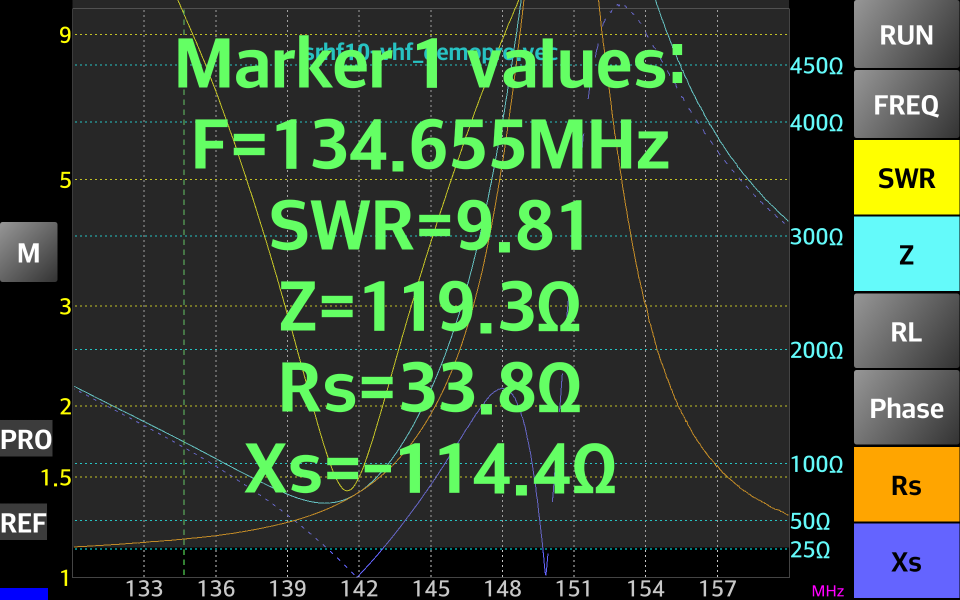
To remove the marker repeat the same gesture as before but in opposite direction, from the middle of the screen to the top. The marker size box can be toggled between normal and full screen size by one tap on it. In full screen mode, it will look like the following image:
When in Reflection mode, slide your finger (gesture) from the middle to the bottom of the screen. This will toggle the display of a grayed box containing all the selected parameter values for the frequency where the SWR has a minimum value.
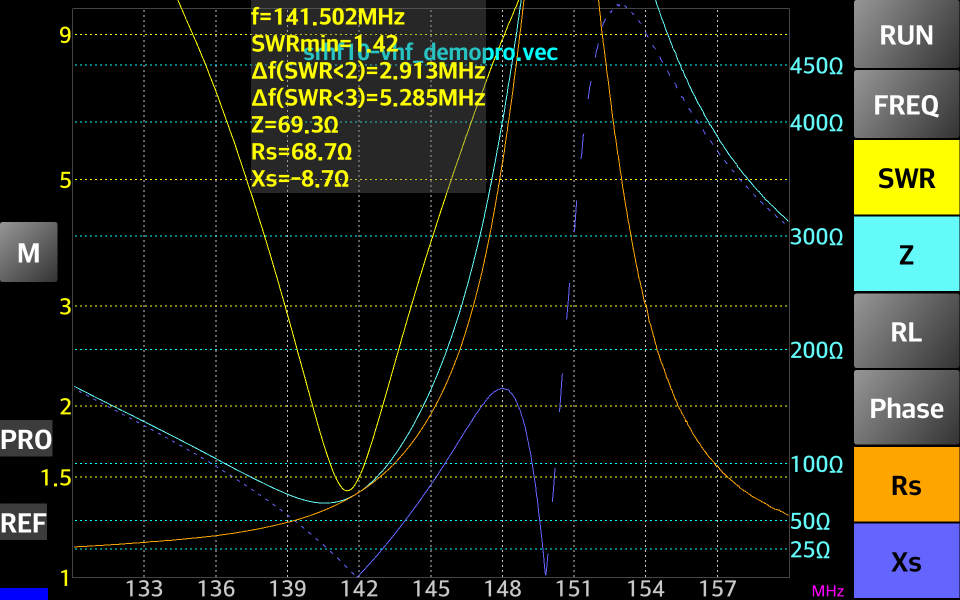
Besides the values for the selected parameter values, the bandwidth (Δf) for a SWR < 3:1 and for a SWR < 2:1 will be displayed too. If minSWR is > 3:1, then the bandwidth value will not be displayed.
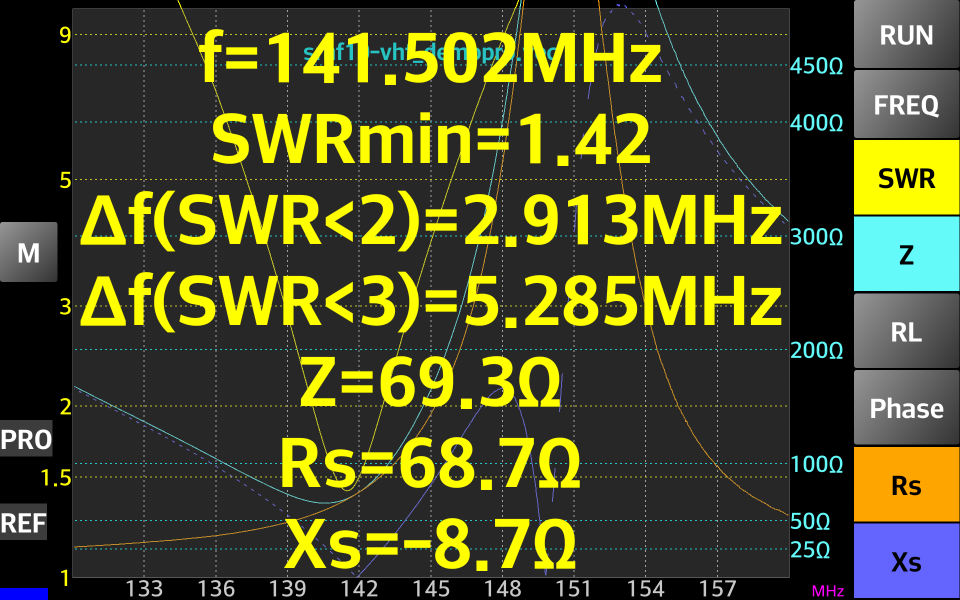
Tapping on the box with the values will toggle between standard and full screen mode which can be useful for work outside to tune an antenna.
Using the same gesture (middle to bottom) will close the box.
Use Android’s “Multi Touch” feature to zoom the graph horizontally or to shift to the left or right, inside the limits of the captured data. By default, the capture is done with 1000 steps, so even if you zoom into the graph, the quality will be maintained. Use two fingers to touch the screen and spread them to zoom in, bring them together to zoom in.
In the following pictures, the original data capture file (top) at full frequency range and then zoomed to the interest zone (bottom) without data recapture.
Full Frequency Range
Zoomed in Frequency Range
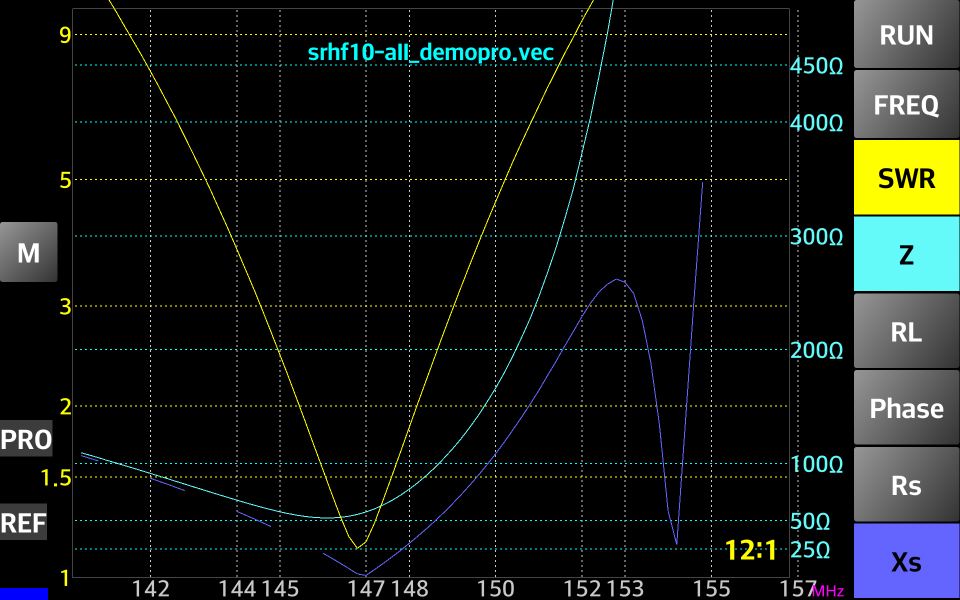
Only when zooming, the zooming level is displayed in the lower right corner of the graph.
You can revert to the default display (no zoom, no shift) by simply sliding 3 fingers (gesture) anywhere on the display.
A useful feature, especially for small screen devices, is to extend the graph to full screen. Tap the screen on the left side of the Y axis in the Loss and SWR values zone.
The buttons from the right side will disappear.
To display the buttons, tap again in the same area.
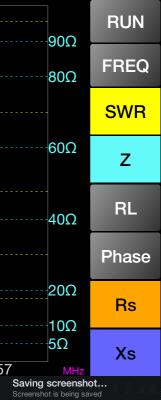
There are 3 possible scales for the impedance: 1000, 500 and 100 ohms. The default scale, the one when the application is started, is 500 ohms.
To change the scale, long press on one of the impedance buttons (Z, Rs or Xs). The scale will be changed in the following order: 500-1000-100-500….
To save captured data, select “FILE SAVE” from the extended menu bar “More.”
A small window will appear prompting to enter the name of the file to save without the extension.
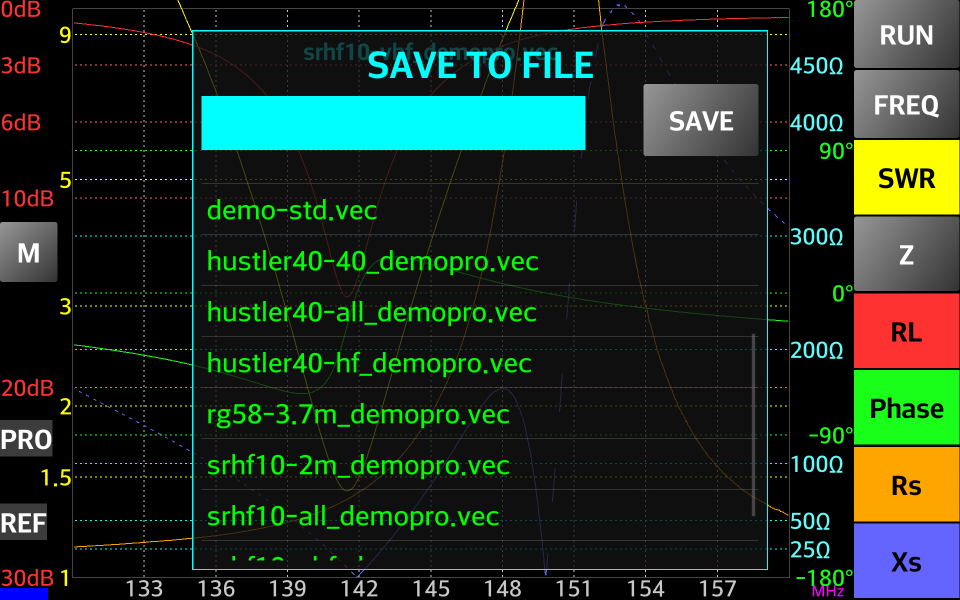
If the Smartphone/Tablet does not have a SD card, data will be saved in the internal memory. The file will be automatically created with the .vec file extension. Enter the name without the extension in the cyan data field from the top or select an existing name to override the file and then press the “SAVE” button.
To cancel the operation, slide a finger from left to right (gesture) over the “SAVE TO FILE” text on top or long press on SAVE button. The window will disappear in a short animation.
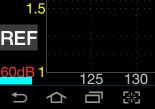
The Smith Chart can be initiated only in Reflection mode.
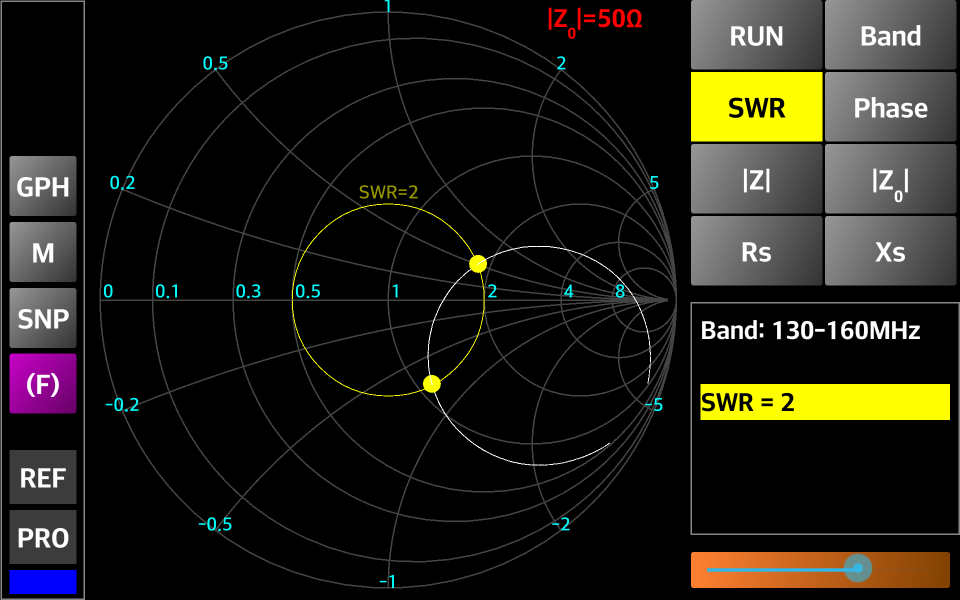
There are two options to activate the Smith Chart when in Reflection mode: using the menu (press on the “SMITH CHART” button or long press the menu “M” button. The Smith Chart will appear as in the following screen:
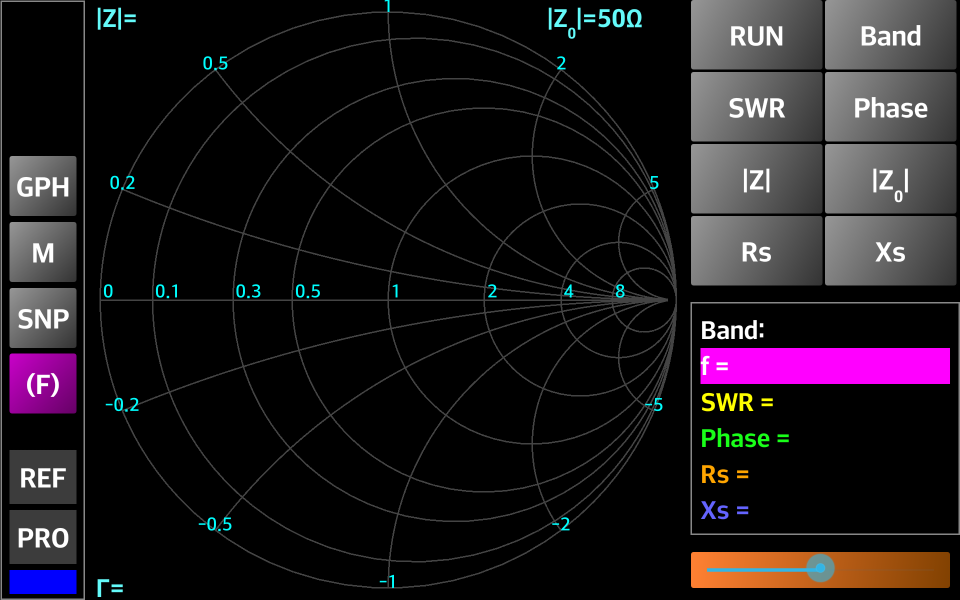
The Smith Chart screen contains the following fields:
GPH - button is used to go back to standard Reflection mode display;
MNU – menu button, same as for standard modes. Long pressing on this button will return to the standard Reflection mode display;
SNP – Snapshot button, used to take a screenshot of the current display. See the chapter “Taking a screenshot” for more details about the generated file.
(F) – frequency button, used to return to standard Smith Chart display (frequency based);
REF – label, used to display current operation mode (always REF – Reflection in Smith Chart display);
PRO – label, used to display currently VNA type (STD – miniVNA standard, PRO – miniVNA Pro or EXT – miniVNA Pro with Extender);
Virtual LED – used to display the connection mode (Blue – Bluetooth, Green – network, Magenta – USB, Cyan – Offline mode, Gray – disconnected);
RUN – button, used to start a new capture (if in Online mode) or to load a data file (in Offline mode). Long press on this button to start a continuous data capture with only 100 Steps (see Capture data from VNA).
Band – same usage as for Reflection or Transmission modes;
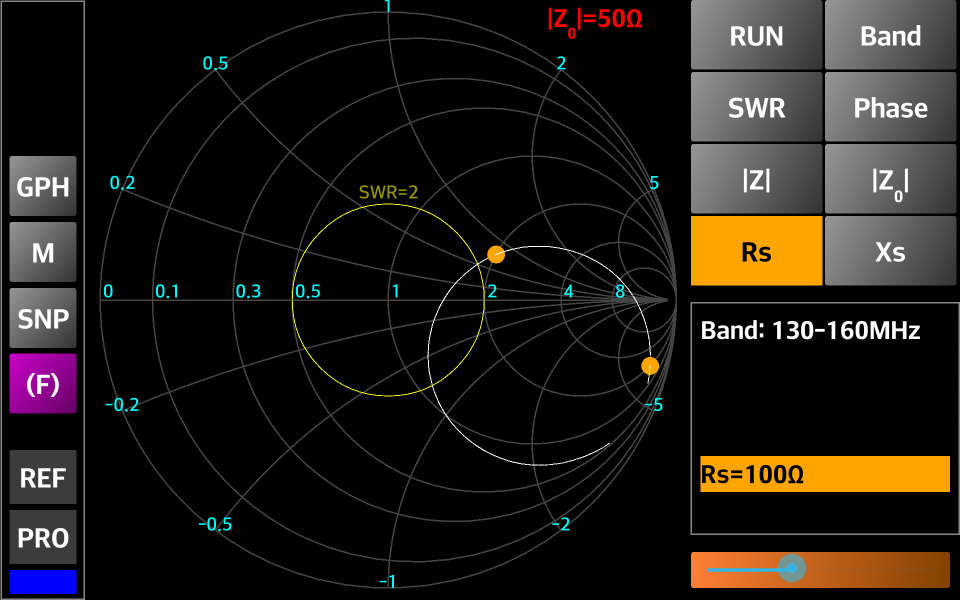
SWR – if this button is pressed, the button color will become yellow and use the slider to set the constant SWR circle on the diagram. The following values are available: 1.05, 1.1, 1.2, 1.3, 1.4, 1.5, 2, 3, 5 and 10. The corresponding “constant SWR” circle will be displayed on the diagram. This circle will remain visible as long as the Smith Diagram is activated, even when selecting another button. The points on the Smith Chart where the SWR has the specified values are represented with a yellow dot;
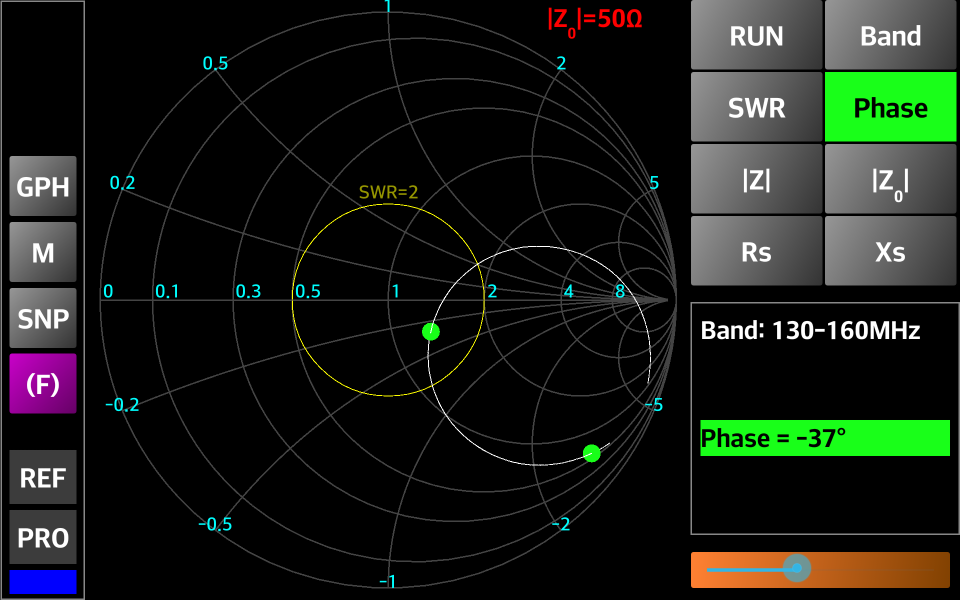
Phase – if this button is pressed, it will change the phase between -180⁰ and +180⁰ using the slider (step 1⁰). The points on the Smith Chart where the Phase has the selected values are marked with a green dot;
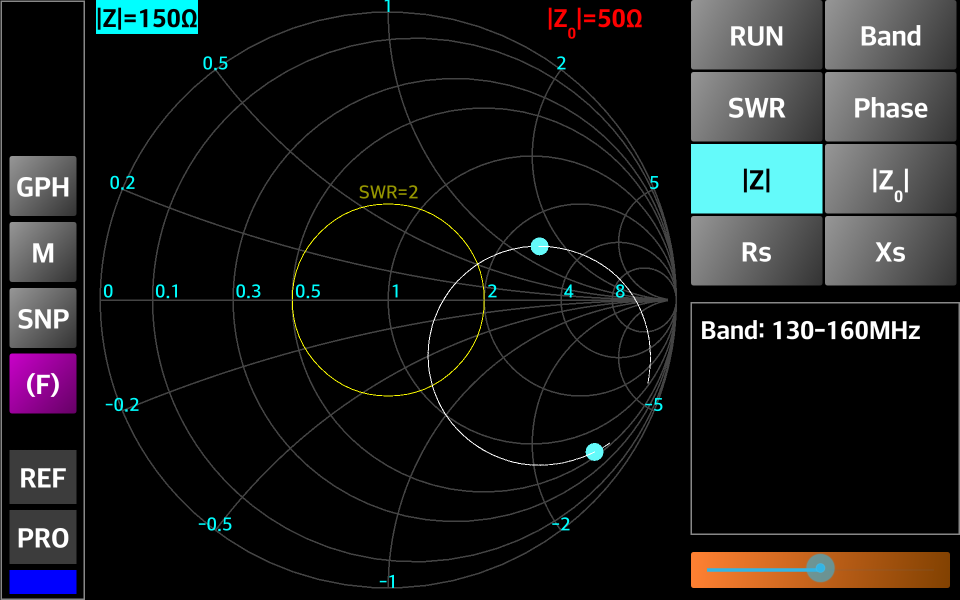
Z - if this button is pressed, it will select one of the following values for |Z|: 25 Ω, 50 Ω, 75 Ω, 100 Ω, 150 Ω, 200 Ω, 300 Ω, 450 Ω, and 1000 Ω. The points on the Smith Chart where |Z| has the selected value are marked with a cyan dot;
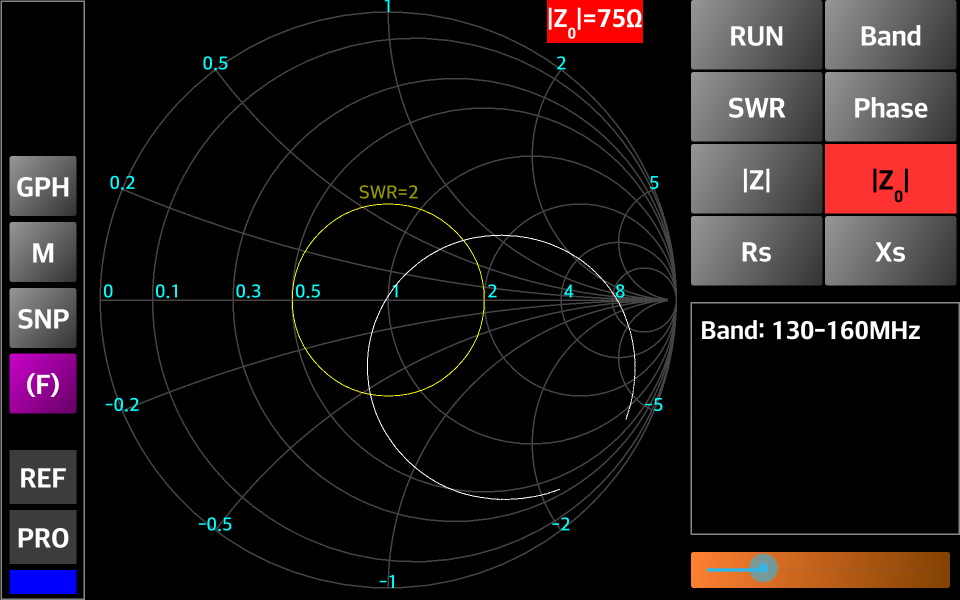
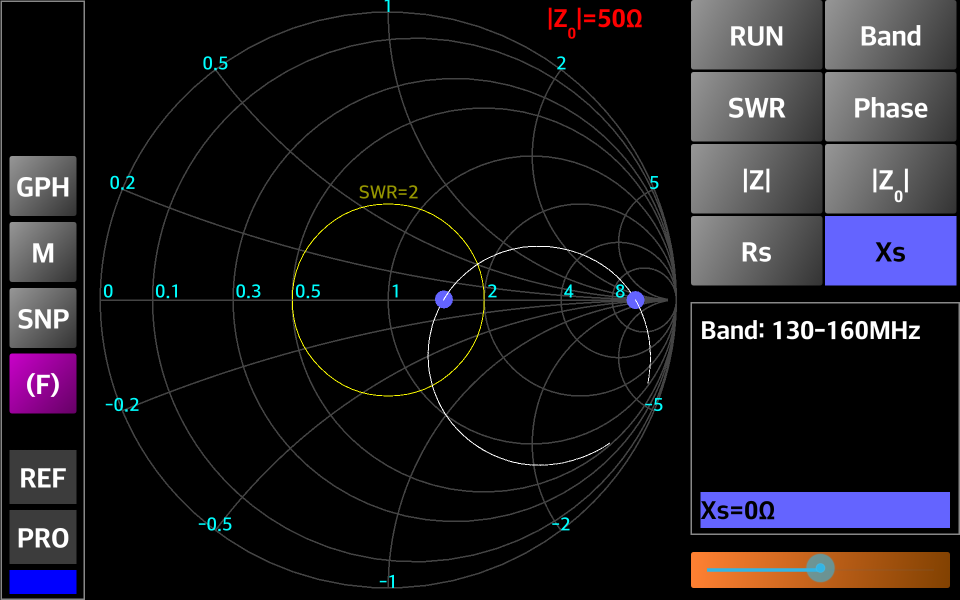
|Z0| - if this button is pressed, it will select a value for the reference impedance from the same list as for |Z|. By default, the Smith Chart is displayed for |Z0| = 50 Ω, but this value can be changed. The selected value is displayed in the upper right part of the chart (with red background).
The new selected value is kept for any new measurement.
Rs - if this button is pressed, it will select a value for the real value of the reactance (Rs). The same values as for |Z| are available. The points on the Smith Chart where Rs has the selected value are marked with an orange
dot;
Xs - if this button is pressed, it will select a value for the imaginary value of the reactance (Xs). The same values as for |Z| are available. The points on the Smith Chart where Xs has the selected value are marked with a blue dot;
Values frame – in this space the current cursor values for Band, f (frequency), SWR, Phase, Rs and Zs will be displayed in their respective colors;
Slider used to go through the available values for each parameter. Position is marked with orange color on the left side;
Current Γ (as a complex value) is displayed on the lower left side of the chart;
Current |Z| value is displayed in the upper left corner.
Note the following is possible, a full 1000 step data capture in the Online mode (press the “RUN” button), continuous capture with 100 steps (long press the “RUN” button) or use a loaded or imported data (use the “LOAD” or “IMPORT” button from the menu).
To use Transmission mode, select it using one of the menus. The operation is similar to the Reflection mode. The difference is that measurements are made using two connections, one generating a signal as an input to the device under test (DUT) and the other connection as an input detector (DET) where the transmission measurement is made. Only Transmission Loss and Phase measurements are available as values.
By default the Transmission Loss scale is automatic set after a capture. 3 steps are used for the end scale values: 30 dB, 60 dB and 90 dB. This is used to get as much dynamic range as possible without user intervention. You can after that change the scale using the 3 buttons (30dB, 60dB and 90dB).
As usually the Transmission mode is used to measure filters, a button named “FLTR” is available in this mode.
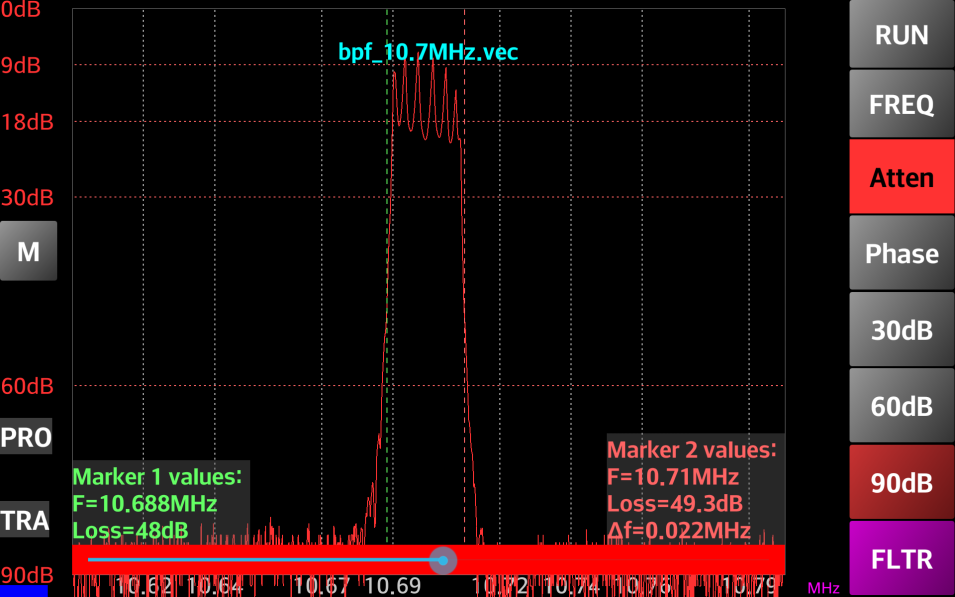
In the following picture you can see a capture in Transmission mode for an X-tal based 10.7MHz band pass filter.
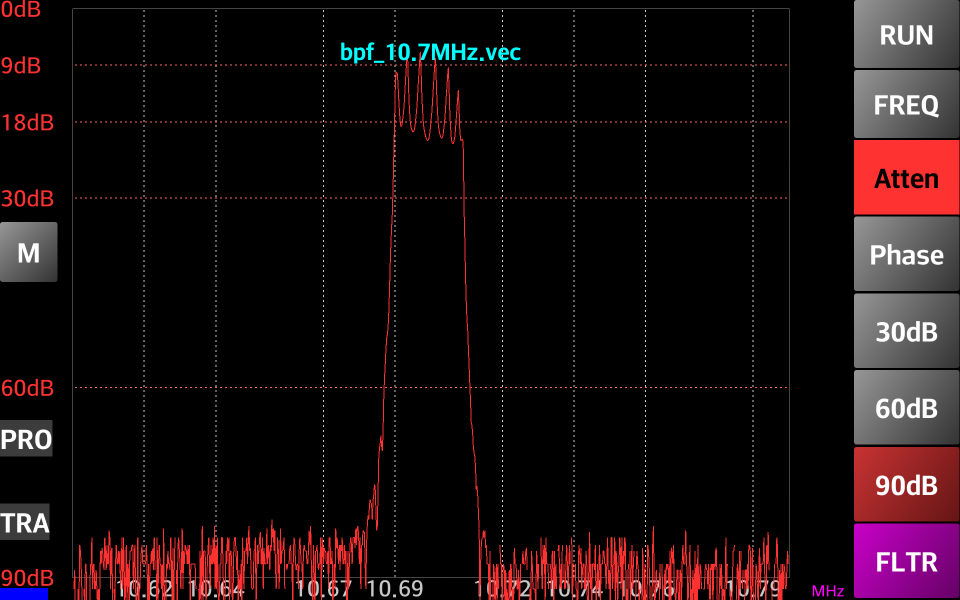
Pressing the “FLTR” button some of the filter parameters will be automatically calculated.

The application can automatically detect (in most situations) the filter type (low pass, band pass, band reject or high pass), adjusting the calculated parameters accordingly. Please be aware that this is still an experimental feature, so it may fail with some filters. Click on the data box to remove it from the screen.
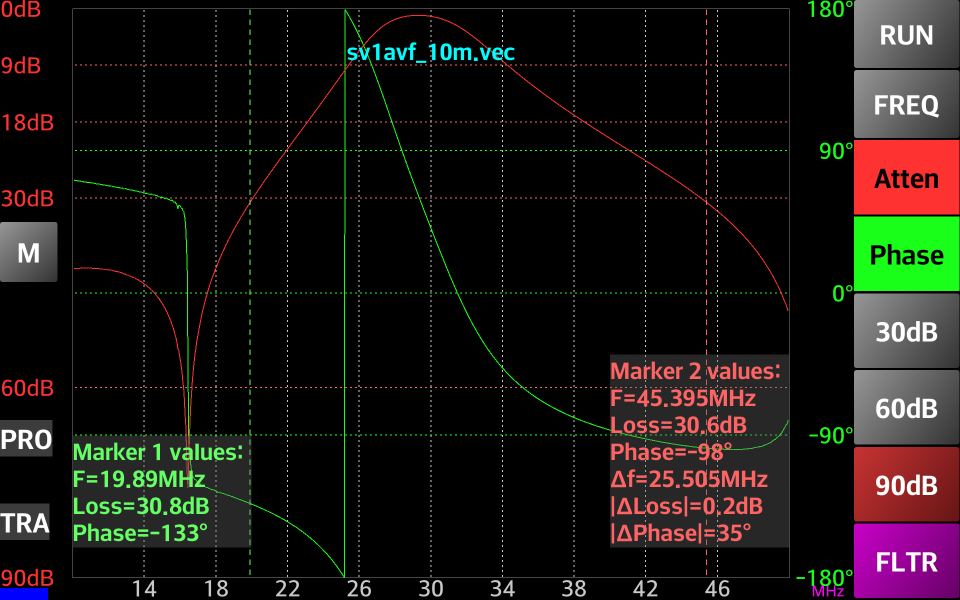
If you want to measure some other filter parameters, or the automatic measurement does not work for a specific filter, you can use the “two markers” feature and read the automatically calculated deltas in the second marker info box.
In the following picture the band pass at 30dB is measured for an LC based band pass filter using two markers.
Long press on the “Atten” button to automatically measure the bandwidth at a specific attenuation.
Two markers will be displayed and a red slider in the bottom of the screen. Move the slider left or right do decrease/increase the attenuation to be considered for the bandwidth measurement.
To take a screenshot of what is currently displayed, touch the screen with four fingers at the same time. A short message will confirm that the image was saved to a file.
The name of the file has the following format: miniVNA-MMDDYYHHmm.png
…where
MM is the month (01-12),
DD is the day (01-31),
YY is the year (12),
HH is the hour (01-24) and
mm is the minute (01-59).
The PNG picture is saved in the /btvna/exports folder.
To load data from a .vec file, select “FILE LOAD” from the extended menu. A small window will appear prompting to select the file to load. Touch the desired file. Follow the same steps described in the Reflection Calibration procedure.On the left side of the screen, in the background, a vertical text showing the current VNA model being used, but only if you load a file saved for a different VNA type than the one currently selected in the startup page. The name of the loaded file is displayed in Cyan color in the upper middle part of the screen.
BlueVNA is able to export data in 3 different formats: Zplots, S1P and CSV. The file formats are shown in the following examples:
Zplots (extension “.zplot.csv”):
"Frequency(Hz)","Return Loss(dB)","±Phase(deg)"
1000000.000000,0.829000,128.496094
1029029.000000,1.063800,160.136719
1058058.000000,1.005100,159.609375
1087087.000000,1.005100,158.906250
…
CSV (extension “.csv”):
Frequency(Hz),Return Loss(dB),Phase(deg),Rs,SWR,Xs,|Z|
1000000.000000,0.829000,128.496094,4.349966,14.158465,23.997530,24.388597
1029029.000000,1.063800,160.136719,4.331952,11.895669,8.718664,9.735549
1058058.000000,1.005100,159.609375,4.165849,12.390331,8.959275,9.880430
…
S1P (extension “.s1p”):
! created by BlueVNA at 11/24/2012 19:22:57
! generated using BlueVNA Android app v0.5.9.5
# MHz S MA R 50
130 0.9163369523325197 144.1483154296875
130.03003 0.9070582405335701 144.41029357910156
130.06006 0.9086618422139108 144.4204559326172
130.09009 0.9079785936809234 144.38973999023438
130.12012 0.907173630498886 144.31277465820313
…
NOTE: See Bibliography for more details about each format.
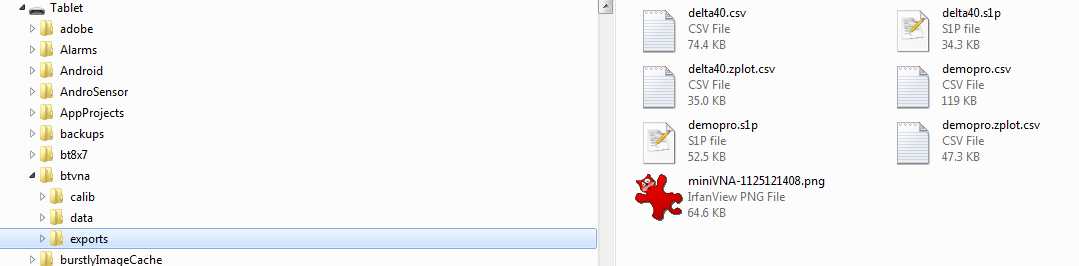
To export data, select “FILE EXPORT” from the main menu. A window will be displayed with a list of existing exported files including their extension.
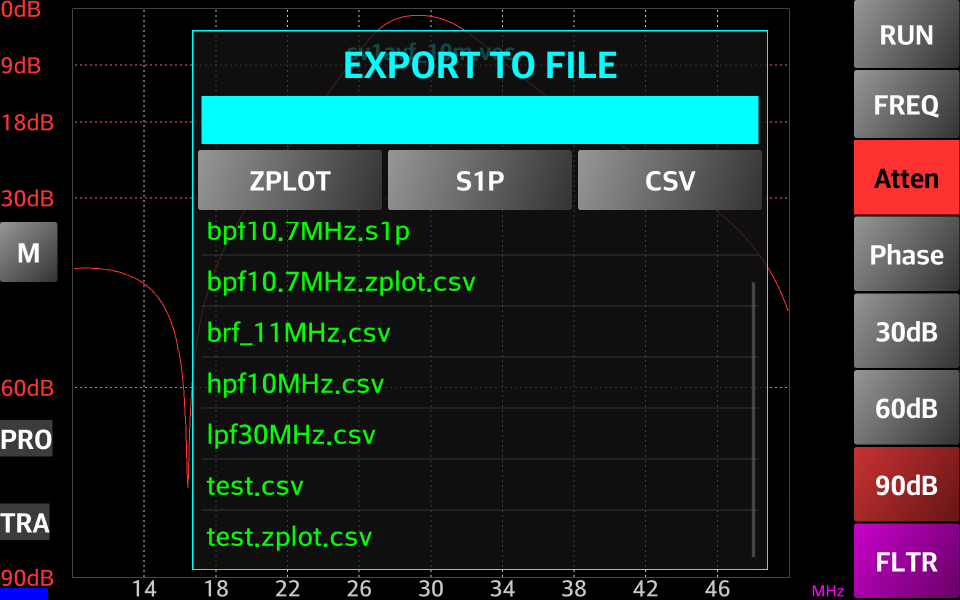
Enter the name of the file in the cyan data field on top or select an existing file to override it.
NOTE: Selecting a different file type to export (i.e., .csv and export it in .s1p) the previous file will not be deleted, but a new file will be created using the same name but with a different extension.
Press the button corresponding to the format in which you want to export the file.
The file will be saved in the “/btvna/exports” folder.
If you want to cancel the operation slide the finger (gesture) from left to right over “EXPORT TO FILE” text on top. The window will disappear in a short animation.
Blue VNA imports data only in the CSV format. The file format must be exactly the one used to export in CSV format:
CSV (extension “.csv”) and captured with 1000 steps:
Frequency(Hz),Return Loss(dB),Phase(deg),Rs,SWR,Xs,|Z|
1000000.000000,0.829000,128.496094,4.349966,14.158465,23.997530,24.388597
1029029.000000,1.063800,160.136719,4.331952,11.895669,8.718664,9.735549
1058058.000000,1.005100,159.609375,4.165849,12.390331,8.959275,9.880430
…
To import a CSV file, press on the corresponding menu item and then select the file from the list of available files of that format. An error message will appear if the file is not in the correct format and the import will be canceled.
This function can be useful to display data captured with another applications (i.e., to display a Smith Chart).
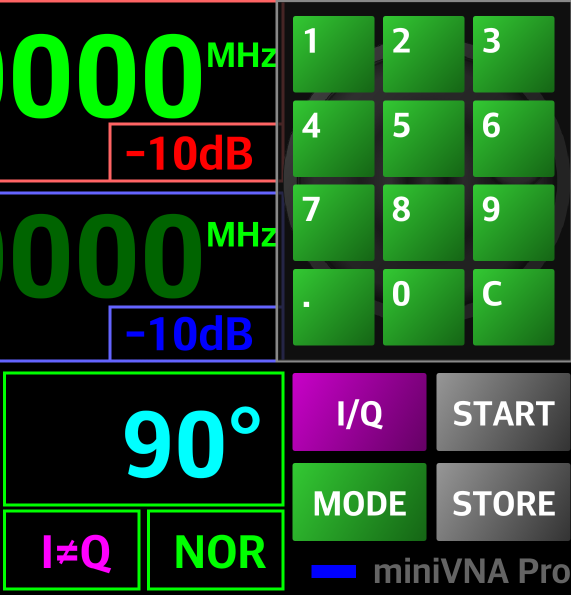
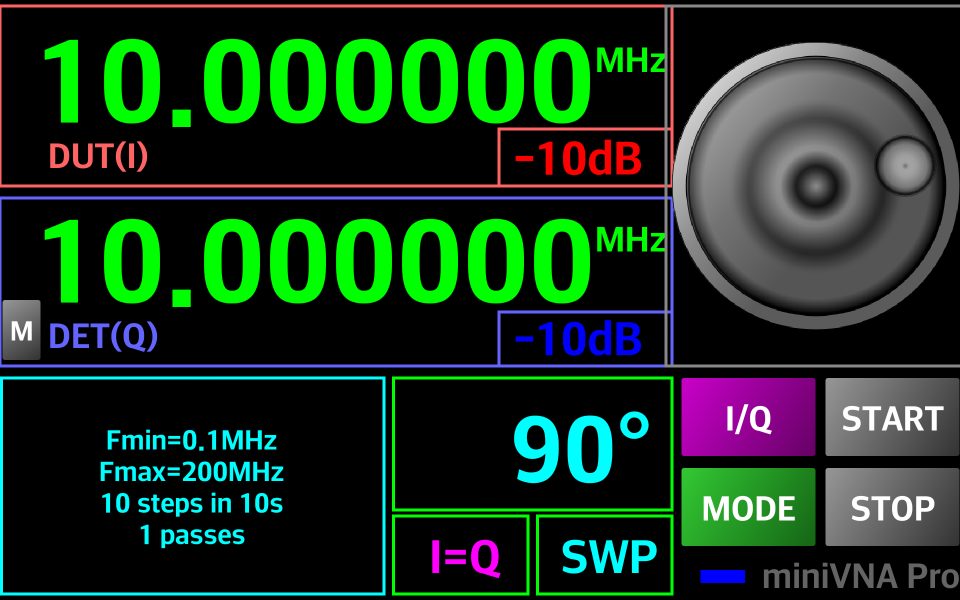
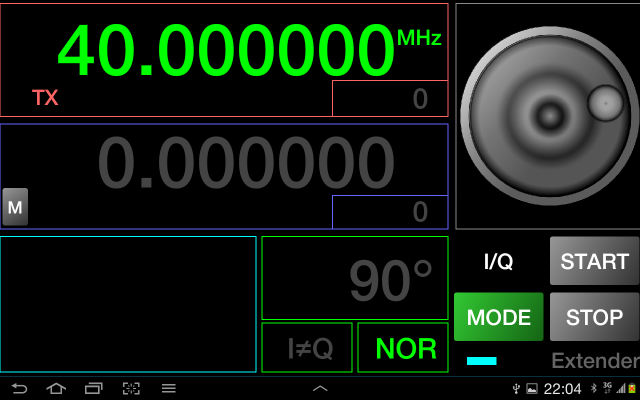
In the main Menu, press “GENERATOR” to enter the Generator mode. A screen like the following image will appear.
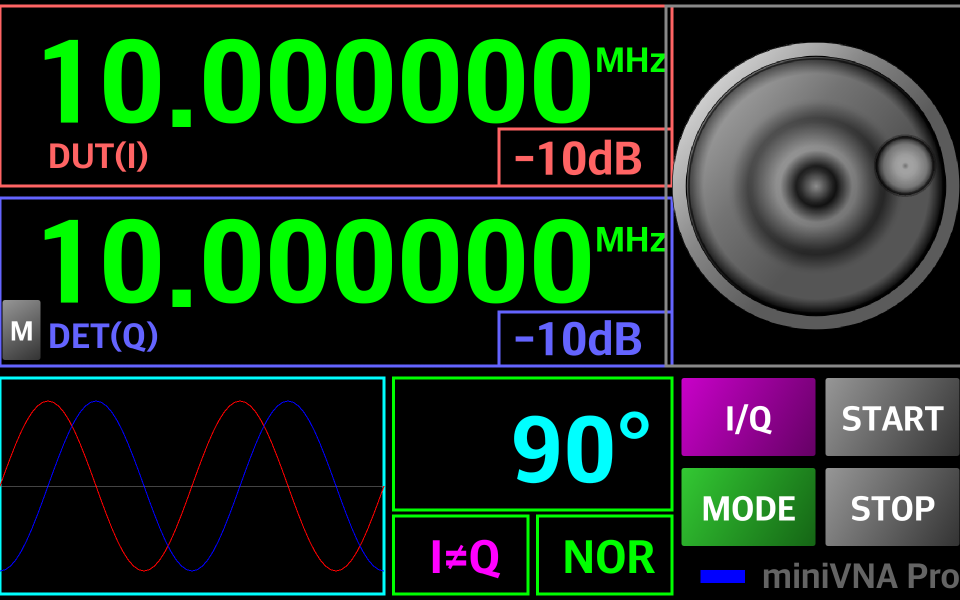
The basic interface provides the following components:
Two large 10 digit frequency displays (including “.”) with a resolution up to 1 Hz;
One red and one blue display for the value of attenuation for each channel;
A cyan phase difference display (for values between 0 and 180 degrees);
A small graph with a symbolic representation of the two signals (I and Q) displaying the current attenuation per channel and the phase difference between them;
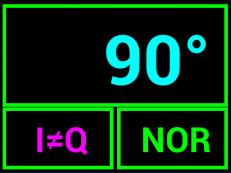
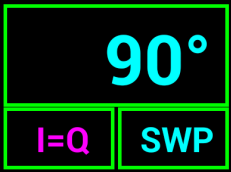
A green box in the lower right side of the screen where the current mode is symbolized by “I<>Q” if the two channels are independent, and “I=Q” if channel 2 frequency is the same as for channel 1;
Two buttons to select one of the modes (I=Q or I<>Q);
“START” button used to start the generator or to enter in Live mode;
“STOP” button used to stop the generator or to set different parameters;
A status LED similar with the other modes;
A rotary knob used to tune all the values (frequency, attenuation, phase) with the smallest step equal to 1;
A numeric keypad replaces the rotary knob in some operations (see further in this chapter);
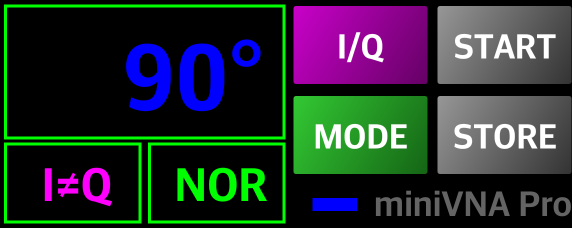
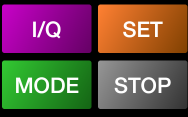
To set a specific parameter, short press the button and it will start flashing. The “STOP” button name will change to “STORE”. This allows changing the value using the rotary knob. The rotary knob has an acceleration feature, so rotating the knob faster will alter the rate of steps being changed.
All selected parameters are changed the same way.
When all parameters are set, press the “STORE” button to disable further editing. The button name will change back to “STOP”.
Long pressing on a parameter other than PHASE the rotary knob will be replaced by a numeric keypad.
Use a short press on the “C” button to delete the last digit or a long press to delete all digits.
Again, when ready, press “STORE”.
The generator can operate in NORMAL (manually or live) or SWEEPER mode. To toggle between the operations modes shortly press the green “MODE” button. Current mode is displayed as in the following pictures.
To operate it manually, short press on the “START” button when in NOR mode. The button will change to orange color and the button text to “SET”. At the same time, the miniVNA generator is started with the configured parameters.
Any further change in the displayed values will not change the generator until the next short press on the “SET” button.
To stop the generator, press on the “STOP” button.
To operate the generator in Live (NOR) mode, long click on the “START” button. The button will change to red and the button name to “LIVE.”

Any change in the displayed values will be automatically transferred to the generator. If no changes are made, no command is transmitted to the miniVNA to prevent the inherent noise associated with the changing of the generator parameters. To stop the generator, press on the “STOP” button.
In sweeper mode the GUI will look like in the following picture:
To set the SWEEPER (SWP) parameters long press on “MODE” button when in SWP mode or press the area containing sweeper configuration data in the lower left part of the screen. An overlay will be displayed which will help you to set the parameters values as follows:
Fmin[MHz] – start frequency in MHz;
Fmax[MHz] – end frequency in MHz;
Swp Steps – number of steps for the sweeper. If empty or 0 then use 1;
Tstep[s] – duration of a step in seconds. Minimum value is 0.1s. Any empty value or below 0.1 will be automatically changed to 0.1s.
Passes – number of passes for the sweeper. This is an integer greater than 1.
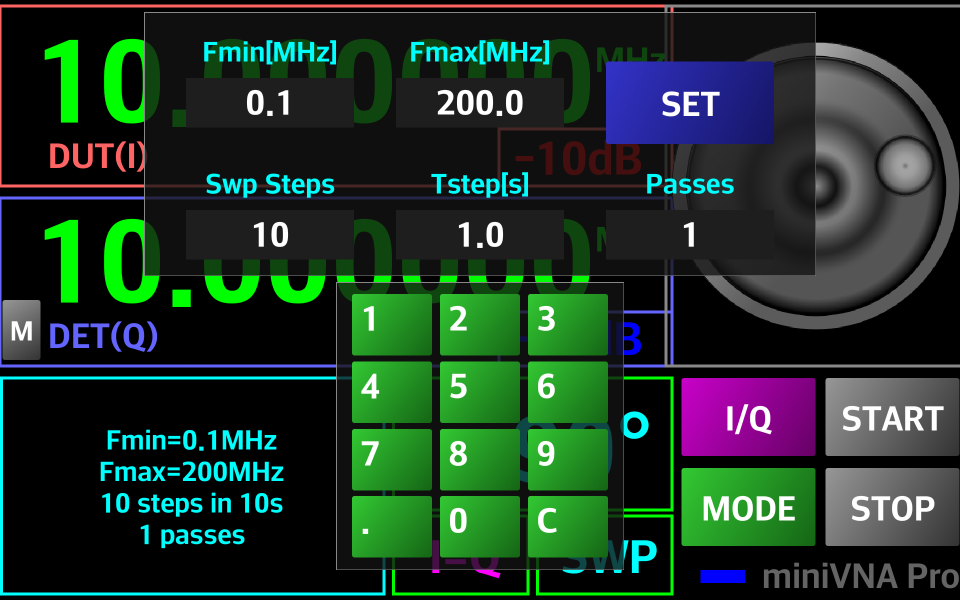
After you enter all the parameters press “SET” button to save them for future use. Values are stored in the configuration file. Now you just have to press “START“ button in order to start the Sweeper. To stop it at any time, even the sweep cycle is not ended, just press on “STOP” button.
For a miniVNA standard or miniVNA Pro with the Extender, only one channel output (DUT for miniVNA standard and TX for Extender or Tiny) is available. The GUI will look like in the following picture in NORMAL mode.
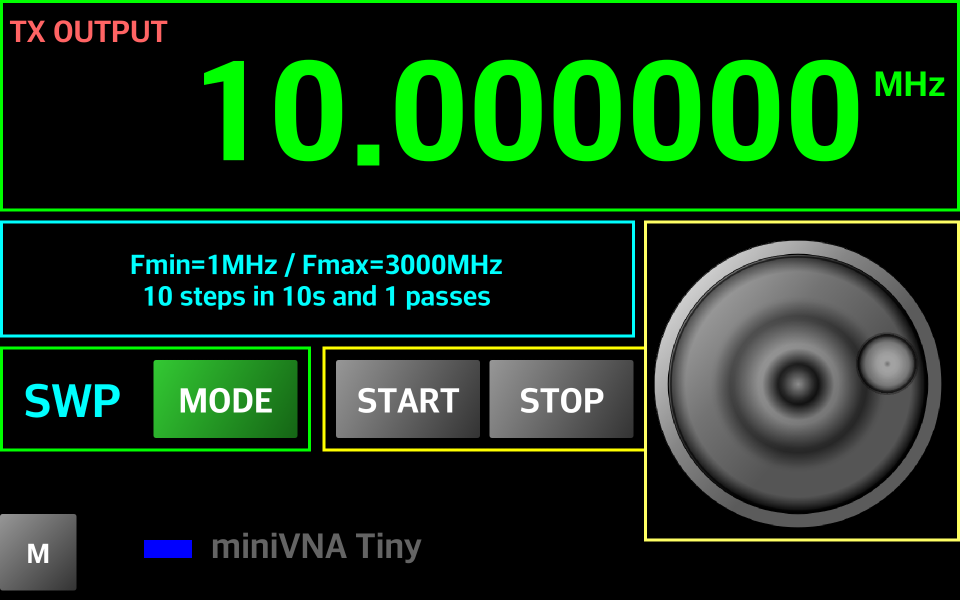
In SWEEPER mode the GUI will look like in the following picture.
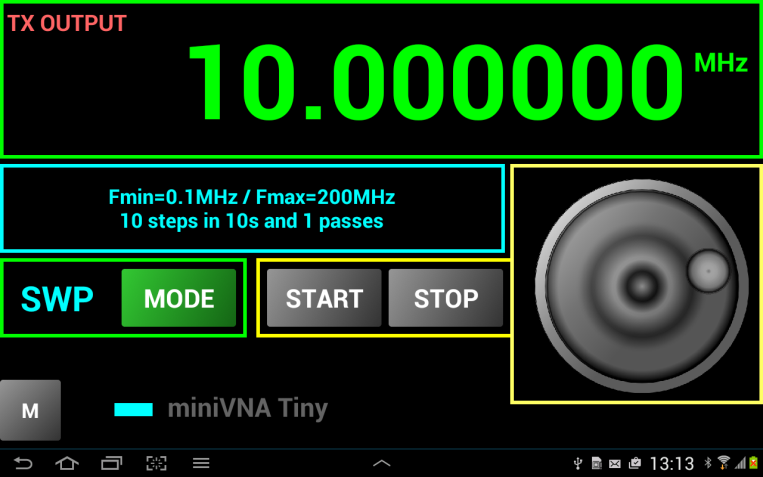
NOTE: You cannot set the output level for miniVNA Standard, Pro with Extender or Tiny.
To calibrate the frequency generated by the VNA that also applies to all other operation modes, select “CALIBRATE” from the menu when in Generator mode. The display will change as in the following image:
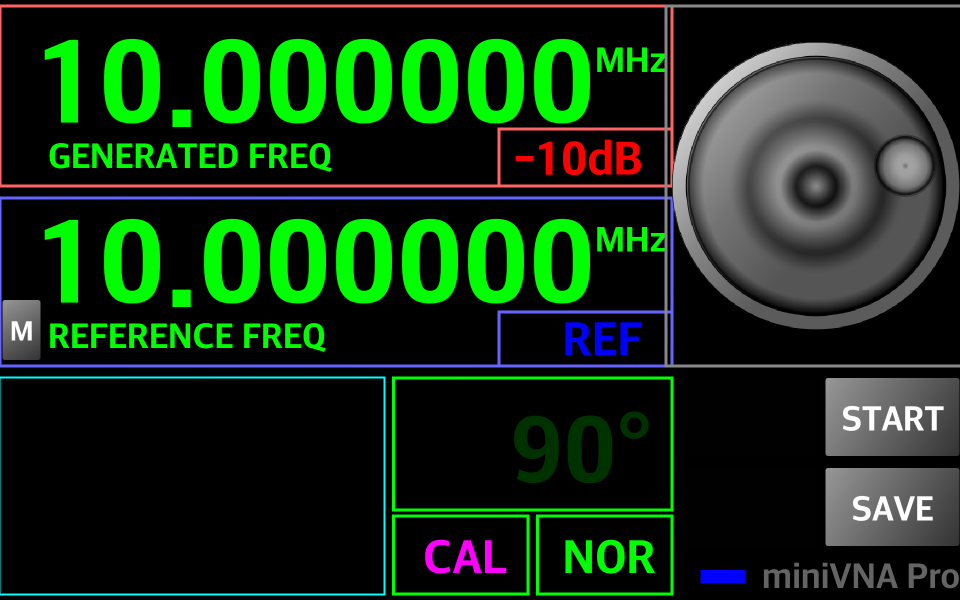
To calibrate, use a very well calibrated frequency meter connected to DUT (miniVNA Pro without extender or miniVNA standard) or TX (miniVNA Pro with Extender). The available frequency range is the one supported by your miniVNA model (0.1-180 MHz for miniVNA Standard, 0.1-200 MHz for Pro without Extender and 40-1500 MHz for Pro with Extender). In this example, the miniVNA will be calibrated using a 10 MHz reference.
Enter 10.000000MHz in both the “REFERENCE FREQ” and “GENERATED FREQ” and long press on the “START” button to start Live mode. Use the frequency meter to measure the generated frequency. Fine tune “GENERATED FREQ” (+ or -) using the knob until the frequency meter will show exactly 10.000000 MHz and then press the “SAVE” button.
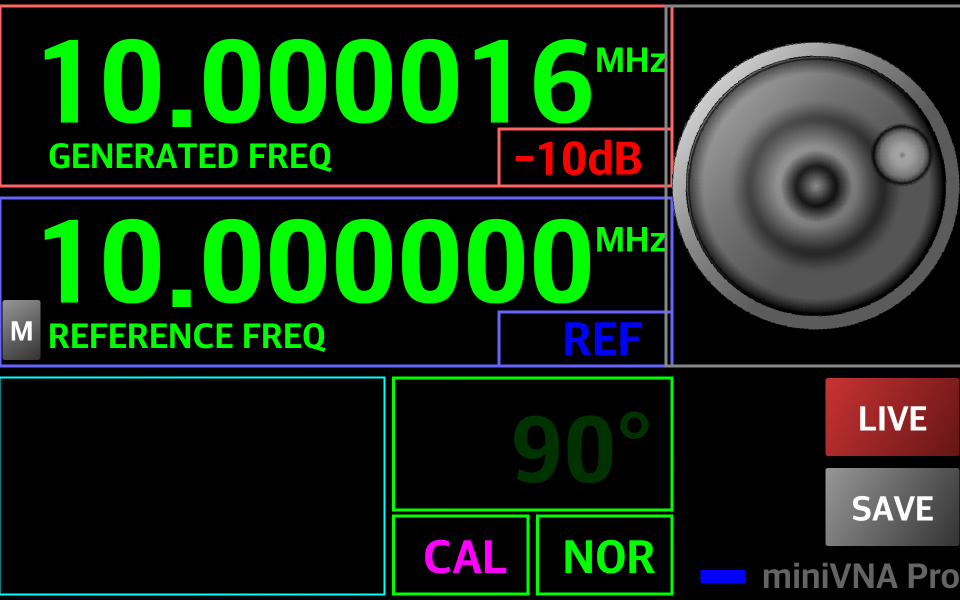
Frequency calibration is completed. Save the frequency calibration data in a calibration file that can be used after a configuration file reset.
NOTE: If the calibrations for reflection, transmission and frequency are done first, then save it to a file, as the data for all 3 calibrations will be stored in the same file, so load just one file to recover all calibration data.
The GUI for frequency calibration will look like in the following picture.
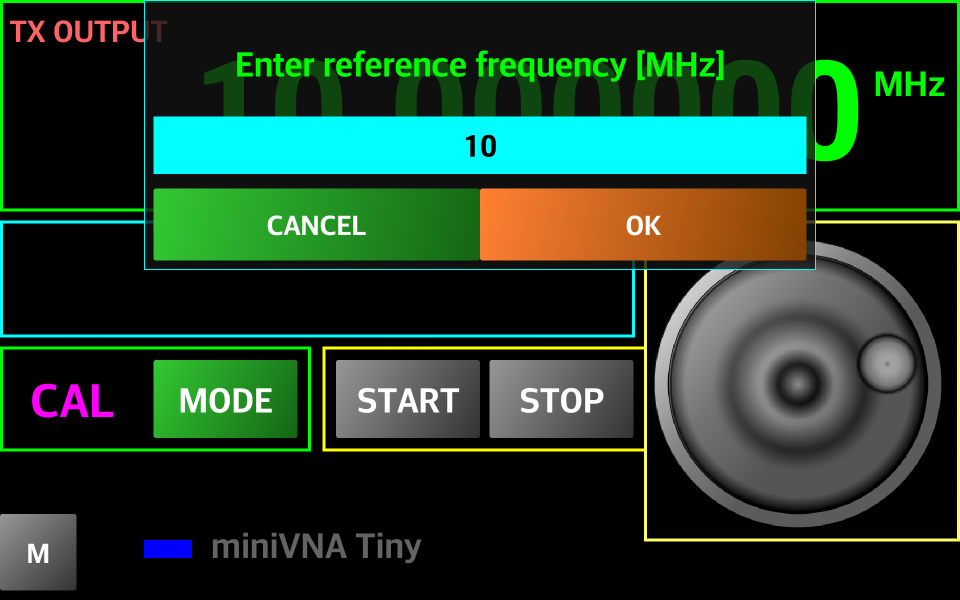
Enter the reference frequency in MHz and press “OK”. Reference frequency will be displayed. Start LIVE mode and change the frequency with the tuning knob till the generator output exactly the reference frequency, then press SAVE.
The correction coefficient will be displayed and the interface will go back to generator mode.
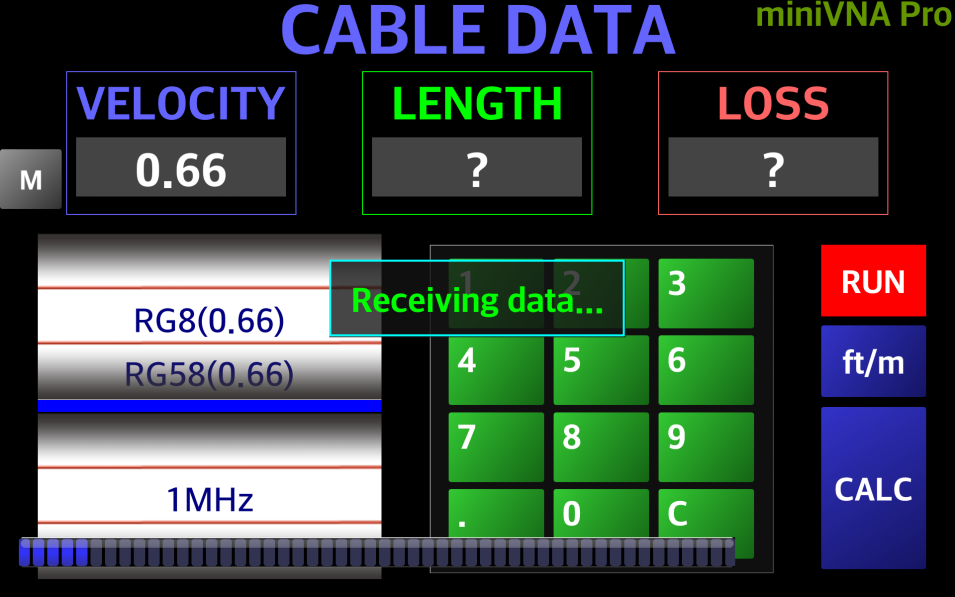
To enter CABLE mode, select “CABLE” from the Main Menu. A new screen appears as in the following picture:
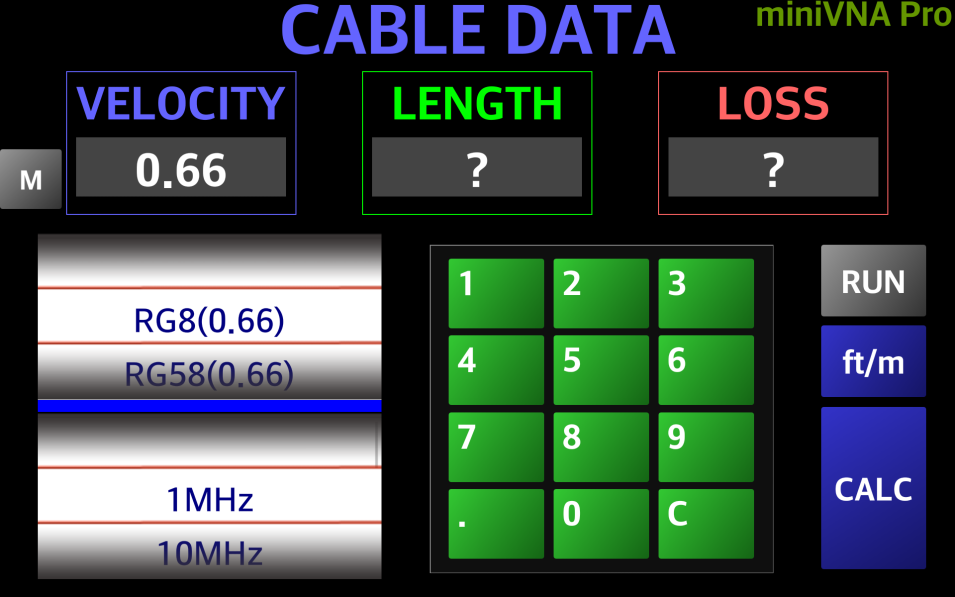
The interface provides the following controls:
Cable type selection wheel (upper). This is used to select the cable to be measured. If not in the list, it can be manually entered with the Velocity Factor in the corresponding data field.
Frequency selection wheel (lower). 7 representative values are used: 1, 10, 30, 50, 100, 150 and 200 MHz. For these frequency values, the loss of the cable will be displayed;
A long bar between the two wheels acts as an indicator light which shows the connection status (blue if connected through Bluetooth or green if in the Offline mode).
A numeric keypad to manually enter the parameters in the only two editable fields: Velocity Factor and Cable Length.
A data field to display the measured and calculated cable loss.
A “RUN” button is used to start a data capture from the VNA or to load data file when in the Offline mode.
A “Ft/m” (Feet/meter) button is used to toggle between feet and meters when displaying or entering the cable length parameter.
The “CALC” button is used to recalculate Cable Loss when manually changing Velocity Factor or to recalculate the Velocity Factor when changing Cable Length. There is no need to “RUN” a new data capture if it was already done.
To measure a piece of 50 ohm coax with a length between 1 meter and hundreds of meters, connect one end to the DUT connector of your VNA and leave the other one open, then press the “RUN” button.
The button will become red during the first step of the data capture.
If the cable length is more than a few meters, then the process will be two steps. During the first step, an intermediate value for the cable length will be calculated using the whole available frequency range for that specific miniVNA and the “RUN” button will soon become yellow. When the measurement is finalized, the “RUN” button becomes gray again and the calculated data is displayed.
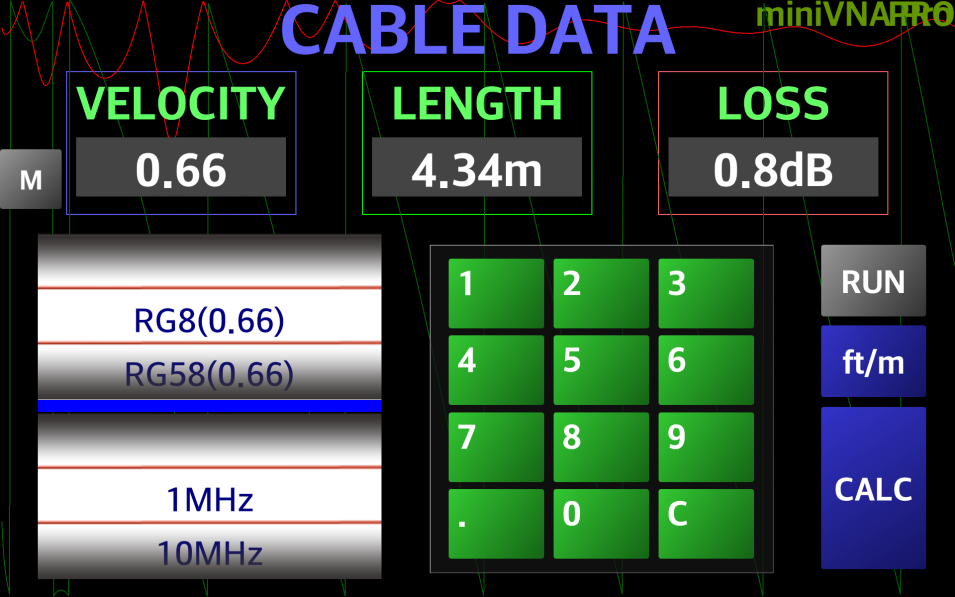
There are 2 graphs in the background. The red graph is for the Return Loss and a green one for Phase. The green graph is used to calculate cable length.
The cable Type / Velocity Factor can be changed using the upper wheel for the frequency where cable loss was measured with the lower wheel. The LENGTH and LOSS data fields will be automatically updated.
The Velocity Factor can be manually changed by pressing on the value data field. The data field becomes cyan and allows manually entry of the new Velocity Factor from the numeric keypad.
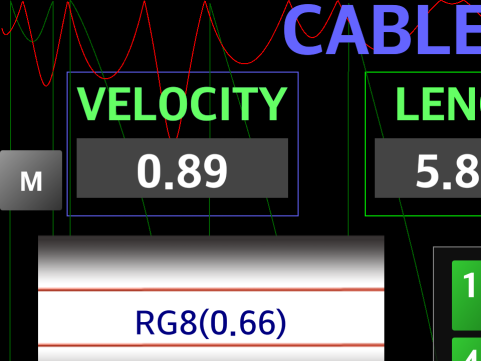
Press the “CALC” button to recalculate the cable length based on the newly entered Velocity Factor. There is no need to run a new data capture. You will be prompted
The cable length factor can be manually changed by pressing on the value data field. The data field becomes cyan and allows entry of the new cable length from the numeric keypad. Take care to use the current scale, feet or meters.
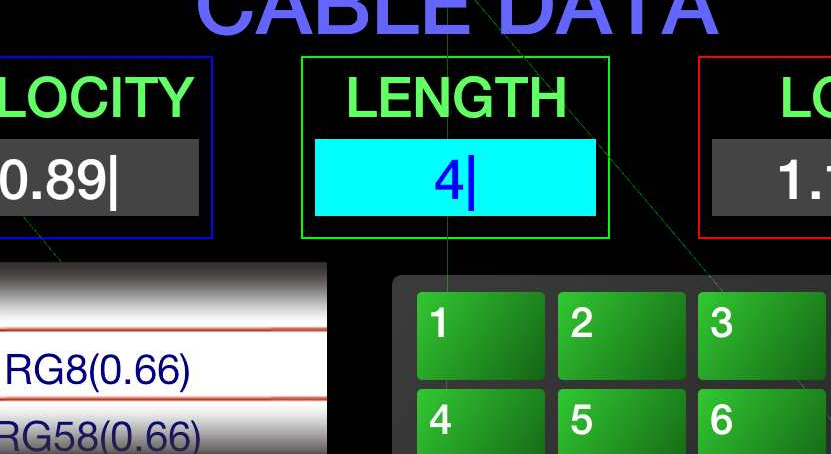
Press the “CALC” button to recalculate the Velocity Factor based on the newly entered cable length. There is no need to run a new capture.
NOTE: In the current version, the cable loss measurement is only approximated. Perhaps in a future version a better algorithm to provide higher precision is being considered. For higher precision for now, use the Transmission mode, but access to both ends of the cable are required.
For this purpose, first run a capture for the new cable. Then, change the parameter value for the Velocity Factor and press the ‘CALC” button.
A prompt will be provided to save the new cable type.
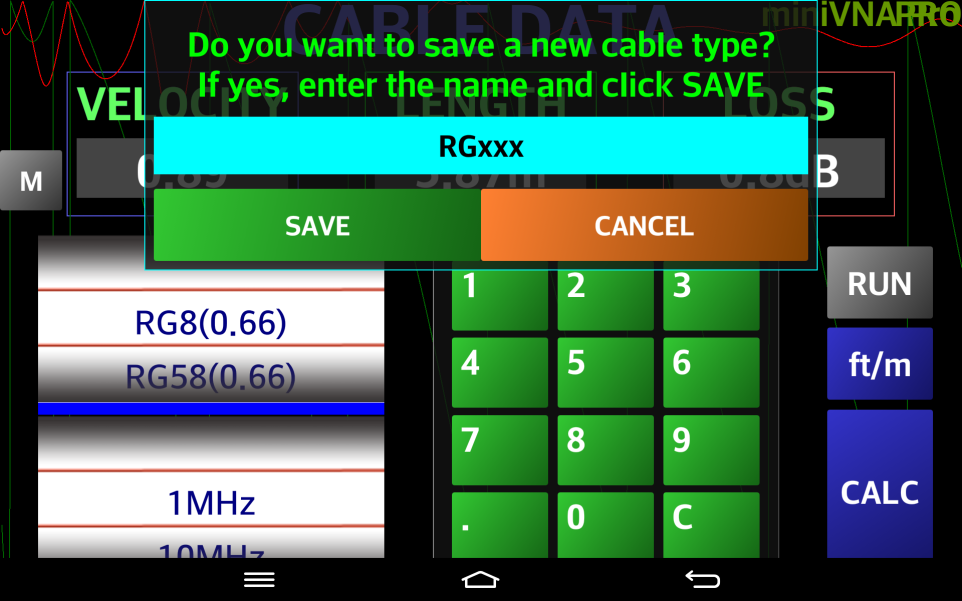
Enter the name of the new cable and press the “SAVE” button. The new cable type will be added at the end of the list. To cancel, press the “CANCEL” button. The data is saved in the application configuration file and will be available at the next application start. The value is lost in the configuration file if a reset operation is made.
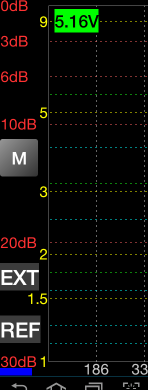
When in Online mode, connected to the miniVNA, its battery voltage is displayed on the screen in both Startup and the main page for Reflection and Transmission modes only).
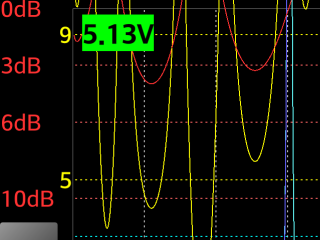
The voltage is displayed with black characters on a colored background. The color of the background depends on the battery voltage as follows:
Vbatt > 3.6V - green
3.2V < Vbatt < 3.6V – yellow
Vbatt < 3.2V - red
A fully charged battery displays a voltage of about 4.2V. When the miniVNA is connected to an external power supply the displayed voltage can be even over 5V. The miniVNA will probably stop working if the voltage is below 3.1V.
To toggle the battery level display, press on it and the background will become semitransparent gray.
The purpose of this mode is to adjust SWR to minimum without having to look at the display. One very practical use of this function is for outdoor antenna adjustments. It's hard to read a display on an Android phone in bright daylight. Further, both hands are used when adjusting an antenna. In this mode, an audio sine wave tone is heard in the speaker or earphones of the Android device. Be sure to set the device volume.
The pitch of the audio tone is dependent of the SWR reading for the selected measurement frequency. The higher the SWR, the higher audio pitch. For an SWR=1:1, the pitch is 400 Hz. For an SWR=2:1 the pitch is 1200 Hz. When the pitch is close to 5 kHz for the upper SWR of about >1:30 and this is the upper limit for this function. To obtain good audio resolution for low SWR values and still have a large dynamic range, a logarithm function is used, as illustrated in the following diagram:
When using this function, adjust for the lowest pitch and when this has been found, look at the display in order to see the actual SWR value.
The formula used for the generated frequency is the following:
f= 400 + 2657.5*log(SWR) [Hz]
To activate the SM6ENG Audio mode use the following steps:
Go to reflection mode (it cannot be used in any other mode);
Connect the antenna (or the component to measure) to the miniVNA DUT port;
Long press on the “RUN” button to start continuous capture;
Select the desired parameters from the corresponding buttons. SWR is mandatory for this mode;
Activate the marker and move it to the desired frequency;
Long press on the “SWR” button, as it must be activated first to start the SM6ENG Audio mode. A 400 Hz tone corresponding to an SWR of 1:1 will be heard in the speaker/headphones for a few seconds. Then, the tone corresponding to the displayed SWR will be heard;
The tone’s frequency will be automatically updated after each data capture, accordingly to the new SWR value;
The marker and the marker values box can be moved. Other parameters (except SWR) can be selected or unselected when SM6ENG Audio mode is active also without exiting this mode;
SM6ENG audio mode can be deactivated in any of the following ways:
Stop the continuous capture;
Deactivate the marker;
Press on the “SWR” button again;
Extend the display to full screen;
Change to another mode (i.e., Transmission, Cable or Generator);
NOTE: The SM6ENG Audio mode is also useful to locate bad connections. If the pitch of the audio tone is changed when a cable or connector is moved, then this is an indication of a bad connection.
In this mode you can measure specific parameters for X-tals, inductors, capacitors or resistors.
NOTE: Considering the limitation of miniVNA in terms of impedances, this mode provides acceptable results only for small capacitors (< 1nF), small inductors (< 100uH) or small resistors (< 1000 ohm). Any feedback or suggestions for improvement are welcome. Do not use this mode to measure the exact value for L, C or R, but more to measure the behavior of the component with frequency (like resonance frequency, parasitic C, R for inductors, parasitic L, C for resistors, or parasitic R, L for capacitors.
To enter this mode, press the brown “XLCR” button in the graphical menu when in any other mode. This will force the standard reflection mode screen with the label changed to “XLCR” instead of “REF”.
Connect the component to be measured to the DUT connector using shortest wires possible.
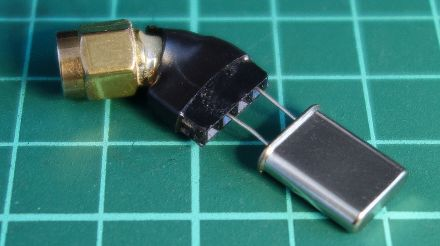
I’ve built initially for myself a simple adapter like in the following pictures (still too big/long for very low value capacitors or inductors).
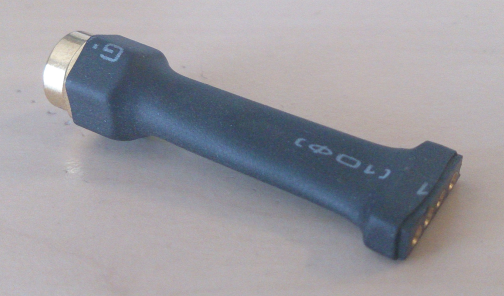
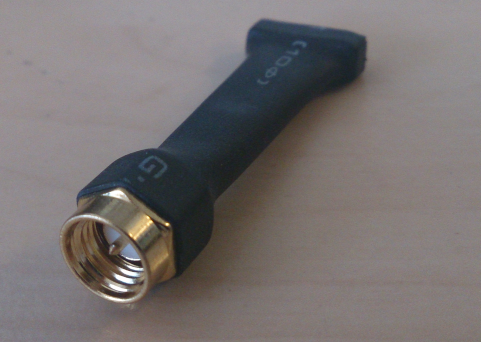
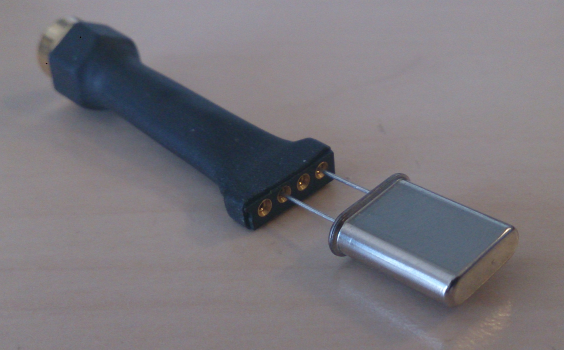
Next, I’ve shortened the adapter as in the picture below:
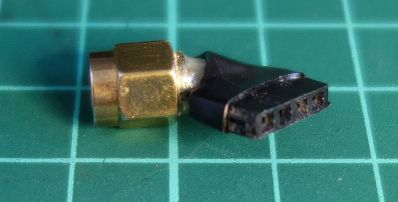
For best results try to recalibrate for OPEN, SHORT and LOAD (50ohm) with the adapter connected. Take care to use a 50ohm non-inductive resistor with as shortest leads as possible.
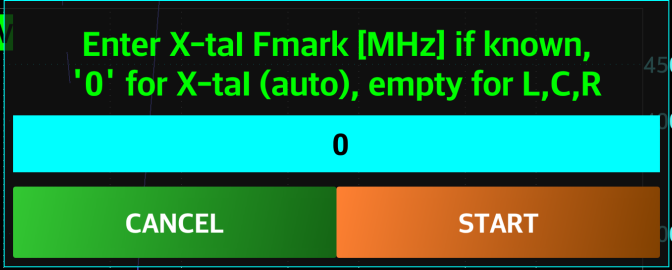
You can measure X-tals in two modes: manual or automatic. In manual mode, you must enter the frequency marked on the X-tal (if known). In automatic mode this is automatically detected, but in a two steps process. To start the measurement, press RUN button. You will be prompted to enter a value for the frequency (in MHz).

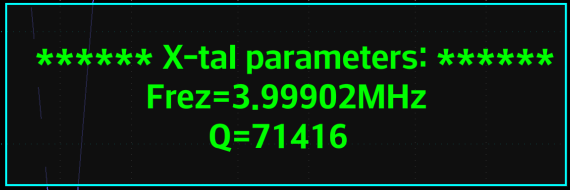
To manually measure X-tal parameters, enter the frequency marked on the X-tal case and press START. A data capture around the marked frequency will start. At the end, you will get the exact resonance frequency and the quality factor.
To automatically measure X-tal parameters, press RUN button and then enter 0 as marked frequency.
Press START button. The range 1-60MHz will be scanned in 1MHz intervals. Because of a very sharp characteristic of an x-tal, is not possible to do a single scan for the whole range. When the approximative resonance is found by a sharp minimum for the Xs, another scan will be made on a short interval around that frequency. At the end the reflection mode graph and the x-tal parameters will be displayed.

For this you can select the desired frequency range using FREQ button. You can start with the full range available for the analyzer (ex. 100KHz-200MHz). Connect the component to be measured at the DUT port using an adapter like the one described before. Press RUN button.

When prompted, do not enter any value and just press START.
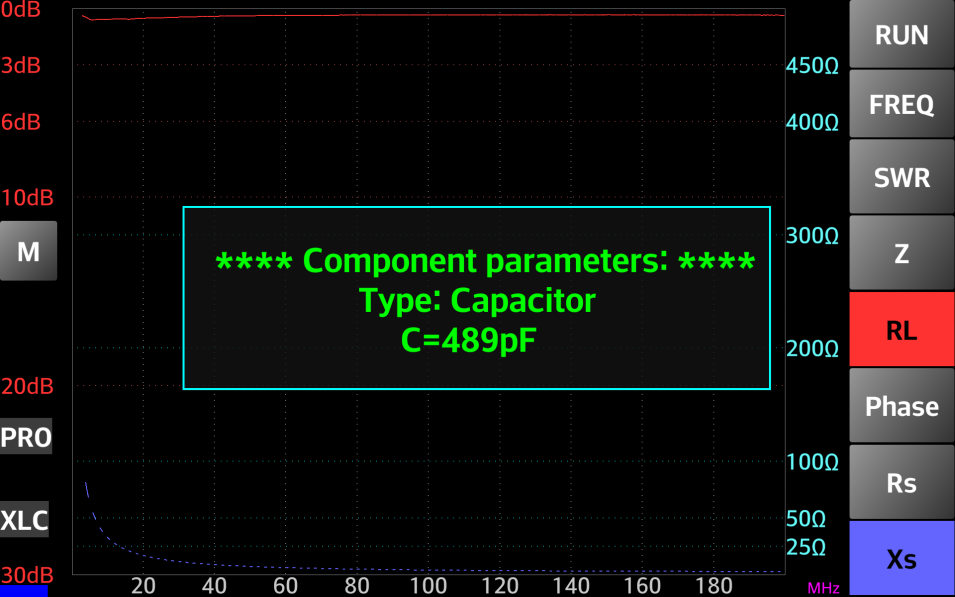
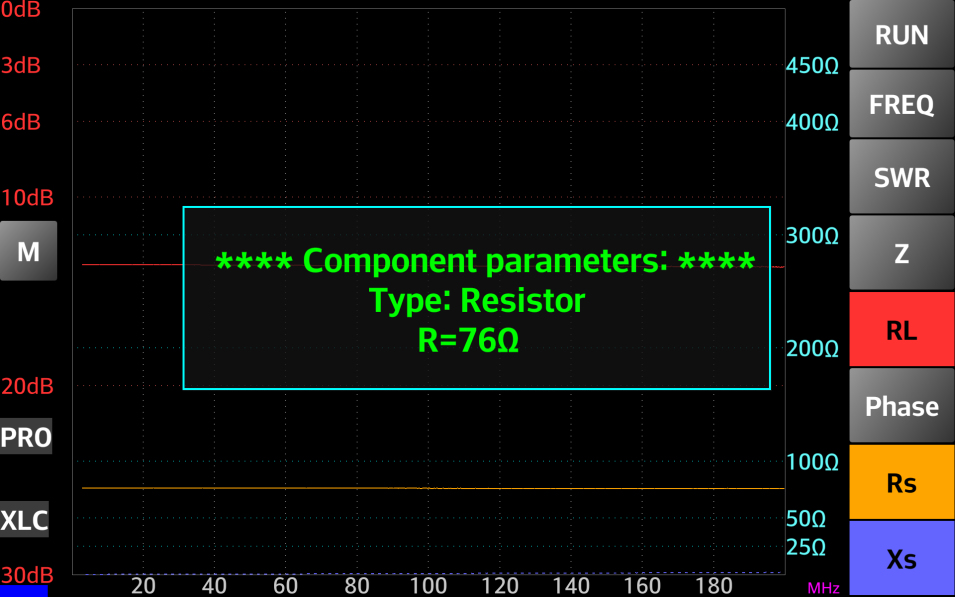
A capture for the selected frequency range will be performed. The application will try to automatically detect the connected component. If this will be possible, then the component parameters will be displayed in a pop-up window.
Some examples:
A capacitor:
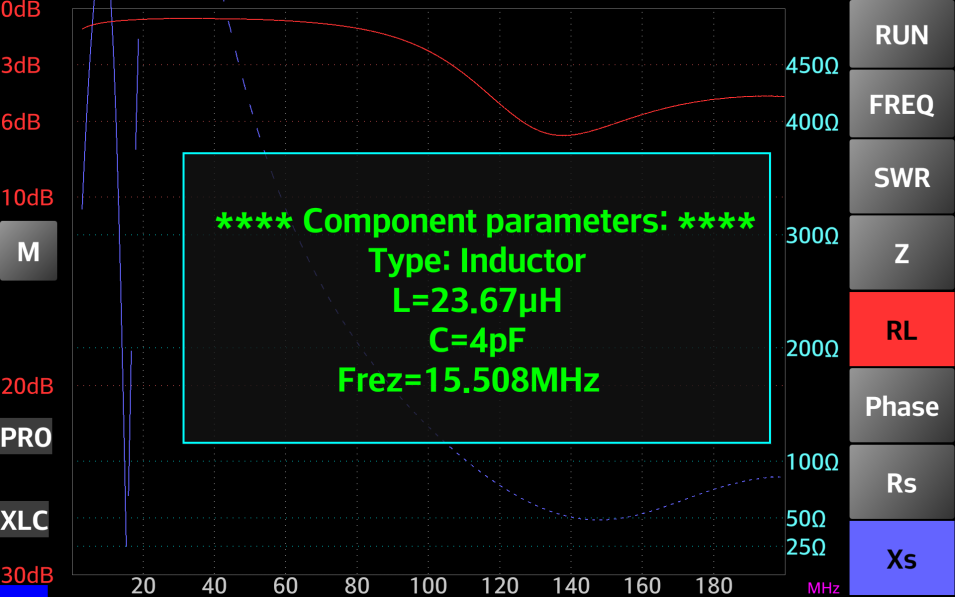
An inductor:
A resistor:
Unknown component:

After the capture you can activate the first marker (yellow) in order to display some other parameters for a specific frequency. Where the Xs value is negative, an equivalent capacity is calculated based om formulas from here. Where XS is positive, an equivalent inductance is calculated.
To change the default DDS frequency, when you are in miniVNA Standard or Pro mode slide the finger vertically over the info box in the right part of the startup screen.
The following box will be displayed:
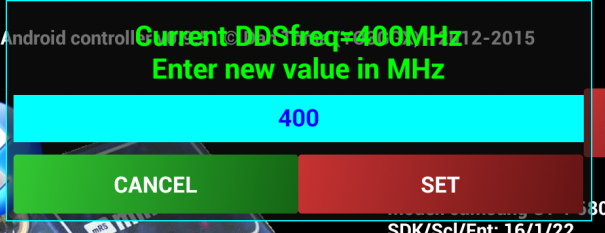
You can enter only one of the following values for miniVNA Standard: 180, 192, 196, 400 or 1250 MHz.
You can enter only one of the following values for miniVNA Pro: 500 or 520MHz.
The application can be used without a miniVNA device, in Offline mode. To enter the Offline mode:
Start the application with the Bluetooth interface disabled;
Start the application with Bluetooth enabled, but without the miniVNA. The application will try to search for available Bluetooth devices and list them all. The last one will be a virtual device named “Offline mode”. Select “Offline mode.”
When in Offline mode, the virtual LED in the left lower corner and will become Cyan.
When in the Offline mode by pressing the “RUN” button, it will automatically start the FILE LOAD routine, independent of the operation mode (REFLECTION, TRANSMISSION or CABLE). Loading previously saved file or files saved with the Windows application (in miniVNA standard mode) can be done.
Blue VNA can operate in the Offline mode in the same manner as in Live mode for all modules.
Use the procedure described in the previous chapter to transfer exported files to a PC. Exported files are located in the “/btvna/exports” folder.
Open “ZPlots.xls” to start AC6LA Software - Zplots Excel application.
Follow the instructions provided by Dan (AC6LA) in his web page.
Zplots is an Excel application that allows exported data from VNA Blue or other sources to be plotted. Plots can be an XY axis chart, a Smith Chart or in a tabular format.
The XY axis chart can be customized with a choice of trace lines. Frequency (in MHz) is always shown on the X axis on the primary (left side) or secondary (right side) Y axis. The following data can be plotted:
SWR - Standing Wave Ratio
Rs - Resistance, series form
Xs - Reactance, series form
Zmag - Impedance magnitude
Theta (degrees) - Impedance angle
Rho (magnitude) - Reflection coefficient magnitude
RL (dB) - Return Loss, plotted as a negative number to show "reverse" scale (see note below)
Phase (degrees) - Reflection coefficient angle
% Reflected Power in percent
Q - Quality factor, |Xs| / Rs
Rp - Resistance, parallel form
Xp - Reactance, parallel form
Ls (ľH) - Equivalent inductance for series Xs, both positive and negative
Cs (pF) - Equivalent capacitance for series Xs, both positive and negative
Lp (ľH) - Equivalent inductance for parallel Xp, both positive and negative
Cp (pF) - Equivalent capacitance for parallel Xp, both positive and negative
Operating with the Extender is done in the same way as using a miniVNA Pro without the Extender. There are small differences that are presented below. To use the Extender mode, select the picture containing both miniVNA Pro and the Extender in the startup page.
Use the same procedure as without the Extender and at the end save the calibration data with a relevant name, to make it easier to switch between Extender and non-Extender mode.
When using the Extender, there is a small label (“EXT”) on the left side of the display showing the Extender is in use.
When using the Extender, the minimum and maximum frequencies for the Extender operation are limited to 40-1500 MHz, that displays a different frequency enter frame. See the image below:

The entry mode is the same as without the Extender.
When using the Extender, there are hardware differences and limitations. The data capture in Extender mode takes longer than without the Extender. Data saved with the Extender has the same format.
When using the Extender, the Generator mode has limited functionality in the current firmware version. There is only one output (TX) and there is no variable attenuator function.
The operation mode is the same as for the miniVNA standard.
A full video based demo of the operation will be available in a separate section of my YouTube page here: http://youtu.be/jY4g-aW96t0
This video shows an older version of the application (0.4) which does not support miniVNA Pro, Tiny or the Extender.
Other demo videos will be added in the future, so please subscribe to the YO3GGX channel to be informed.
Please send your feedback. Further development of the application fully depends on YOU.
analyzer_iw3hev · antenna analyzer iw3hev Yahoo Group : http://groups.yahoo.com/group/analyzer_iw3hev/
Touchstone Format (*.snp): http://cp.literature.agilent.com/litweb/pdf/genesys200801/sim/linear_sim/sparams/touchstone_file_format.htm
Zplots (Impedance Plots using Excel Charts):
Measuring with a miniVNA: https://www.nonstopsystems.com/radio/frank_radio_coax-sw.htm
Special thanks goes to Bertil (SM6ENG - http://www.qrz.com/db/SM6ENG) for continuous feedback on each subversion and for the idea of SM6ENG Audio mode;
Version 0.1 (Aug 5th, 2012). Initial version of the application (v0.1)
Version 0.2 (Aug 12th, 2012):
change Demo mode To Offline mode;
automatically entering Offline mode when Bluetooth Is disabled
OHM grid color changed from dark gray to white
message that calibration Is Not available in demo mode
band selection button name changed To FREQ (permanently, no more dynamic)
increase the size for the band selection Button
mode Label in the lower right corner was moved to the left and added a LED in the lower left corner (green - Offline Mode, blue - Bluetooth connected, red - error connecting Bluetooth, gray - not yet connected)
add support for Smartphones and tablets with the following resolutions: 240x320, 320x480, 480x800, 1280x800, only in landscape mode (tested in emulator except 1280x800 which was tested on a Samsung Galaxy TAB 7.7 - P6800 with Android ICS 4.0.4)
screen content adapted to the device resolution / dpi for optimum graphic details
gesture (Multi Touch) support for horizontal zoom and shift without a new data capture
cosmetic changes to some buttons, checkboxes, labels and messages
use DEGREE symbol for the Phase grid values
title bar removed to gain more display space
long click on FREQ button set the band to the full 0.1 – 180 MHz
pressing RUN in Offline mode will initiate File Load routine
correct a bug in reset configuration File (Long press START button)
change progress dialog to standard Android type
save captured data To File in vec format (same as for the VB application). Internal Memory used If no SD card
load saved data (.vec format) from SD (or internal memory if SD not available).
function to load data files (vec format) in Offline mode (no need For a miniVNA)
delete the .vec files directly from the application
replace 4m band with HF (1-30MHz)
correct wrong values in marker data and min SWR
drag 3 fingers to reset the display to default full data
Version 0.3:
Internal version, not released
Version 0.4 (Sep 23th, 2012):
Generator mode added with the following features:
large DIGITS
extremely easy and intuitive operation, even with small screen devices
possibility to manually enter the frequency through a numeric keypad
working in manual frequency set or continuous Live mode
rotary knob to change the frequency in both manual or Live mode
Fast/Slow (100 Hz/10 Hz) steps through the knob or manual +/-1 Hz steps
lock mode to prevent accidentally change of settings
choice of KHz or MHz scale
CABLE data mode added with the following features:
large display objects
extremely easy and intuitive operation, even with small screen devices
no graphs, no specific procedures to follow, everything Is done automatically
just connect the CABLE at the DUT connector with the other end open
include a list of well-known coax CABLE and their Velocity Factors
measure and calculate CABLE length from less than 1 meter To hundreds of meters
CABLE length is measured in 2 steps for better accuracy
operate in meter or feet mode
measure CABLE loss for different frequencies from 1 To 180 MHz
can work in Offline mode if the CABLE was measured before (even in Reflection mode) and data saved
frequency calibration can now be done in a very intuitive way from Generator mode (see section in manual)
replace standard Android keyboard with a larger numeric keypad when entering a custom frequency range
long press the “SET” button to exit the custom frequency entry panel
menu elements redistributed
other small cosmetic changes
Bugs solved:
two presses required on the left side of the graph to go in full screen mode
marker info and min SWR info does not disappear when switching to another band with no data
if changing mode during customized frequency range setting, the panel is not cleared
Java error "Invalid Double" when dragging the marker over ranges where SWR is very high
other small bugs
Features to be implemented in future versions:
X-tals measurement
filters measurement
L/C measurement
Known bugs but not yet solved as of version 0.5
None
Version 0.5 (Nov 7th, 2012):
This is the first version to support both miniVNA standard and miniVNA pro analyzers
Completely redesigned engine for faster operation speed
Redesigned calibration mode to comply with the extended procedure for miniVNA pro calibration
Wizard added to simplify calibration procedure
Redesigned generator mode to control all miniVNA features: 2 independent channels, attenuation, phase
Simplified Save/Load procedures
A lot of cosmetic changes for a greater usability and a higher visibility on small display devices
Version 0.6 (Nov 25th, 2012):
SM6ENG audio mode added for easier tuning without looking at the screen
Battery voltage indicator, check each 15 seconds when online, - green > 3.6V, yellow > 3.2V, red < 3.2V
Impedance scale configurable in 3 steps: 100/500/1000 ohms
Added a slide gesture to close any window inside the app
When pressing “RUN,” the previous data capture is not erased until the new one is displayed
Better marker movement when in continuous data capture, no more screen blackouts
miniVNA model name removed by default on the left side of the graph. The name appears now only if a file for the other model is loaded
font size settings now in separate menu, with full screen operation
Changed animation for file, bands and font size panel hiding
blue and red texts in Generator and Cable mode are now brighter
more relaxed requirements for Marker and minSWR activation/deactivation gestures
export data in csv, Zplot and s1p formats compatible with Zplots and other applications
frequency calibration data is now saved in the calibration data file
saved files now separated into 3 folders: calib, exports and data (existing files moved automatically to the right directory at first run, without user intervention
FILE EXPORT moved to the main menu and FILE LOAD to More
full screen shot feature added by touching the screen with 4 fingers at the same time. Screen shot is saved in the 'exports' folder
ANTENNA mode changed to REFLECTION mode
other small cosmetic changes
Bugs solved:
Xs button truncated in the lower part
Java error if manually entering a frequency starting with "."
Java error if manipulating markers after a continuous capture is stopped
Output level from the generator is 16 dB lower than the one configured
pressing “Freq” again when Band window is open, the background color of the button pad changes its shade and does not close
If the “Freq” buttons pad Is active, press Run and the File load menu appears over the “Freq” buttons without making the “Freq” buttons pad close
Version 0.7 (Dec 15th, 2012):
miniVNA Extender support, range limited to 40-1500 MHz
pressing "BACK" will return to Startup screen, pressing "BACK" again displays prompt to verify application exit
configurable grid transparency and aspect (dotted or dashed lines)
minimum custom frequency range is now as low as 1 KHz without extender and 10 KHz with the Extender
display file name when loading a data file
changed algorithm for X scale representation for better visibility with very small frequency ranges
other small cosmetic changes
Bugs solved:
java error when starting capture on miniVNA standard
Java error if entering font size menu from the startup page. Menu is now disabled in startup page
Version 0.8 (Dec 10th, 2013):
USB support added for both miniVNA standard and Pro, with the prerequisite that the Android device is able to power up the miniVNA over USB
button added to display all menu items at the same time on the screen
extended preset frequency range for each band, added zoom feature for more details
ask to enable Bluetooth at startup if disabled
the vertical marker follows frequency when zooming or shifting
separately the calibration data save internally for extender/non extender so no more need to load calibration data from file when changing from extender to non-extender and reverse
ask to load calibration file or (re)calibrate when selecting CALIBRATION or at first run (with no calibration data)
change DUT/DET labels to TX/RX for Extender mode calibration
LOAD button removed from CALIBRATION mode
UPDT button name changed to "USE"
Wi-Fi support added, if a Wi-Fi-serial module is used with the miniVNA
buttons in the startup page to select VNA type
choose between Bluetooth and Wi-Fi at first connection
application icon changed
picture in startup page reflects connection mode (USB, Bluetooth of Wi-Fi)
Bugs solved:
incorrect phase in miniVNA Pro mode
if switched from Extender to non-Extender, old frequency range is kept and can be out of band
shift modify zoom in low zoom circumstances
if exiting the application from cable or generator mode, at next start transmission mode is selected a Java error is displayed
Version 0.8.1 (Dec 13th, 2013):
revert to the 'btvna' folder to store the data/calibration files from 'btvnanew' folder in the latest update
add Menu shortcut button to Calibration and Generator screens
in Extender mode, added frequency values 200 MHz, 435 MHz, 900 MHz, 1250 MHz and 1500 MHz for cable measurement
in calibration mode, a letter is displayed on the right side of the screen to show the calibration type as R - reflection, T - transmission
Bugs solved:
Wrong message for Transmission LOOP calibration for miniVNA standard
Version 0.8.3 (Feb 25th, 2014) – Not a public release:
Smith Chart added to reflection mode, including for continuous data capture
loss/attenuation auto scale range changed, up to 90 dB in 3 steps; 30 dB, 60 dB and 90 dB
user selectable multi-pass calibration, up to 5 passes
generic auto scale for calibration data representation
Bluetooth automatically reconnect if link drops (you must wait for connection loss detection)
File Import added
progress bar added for data capture
frequency calibration data is separately saved for each VNA type, so you have multiple VNA types, there is no need to recalibrate frequency at each change
possibility to add new cables in Cable mode
all system messages or prompts replaced by inside-app messages for better visibility
Bugs solved:
SM6ENG mode broken in previous version
sometimes a Java error pops up when trying to follow the procedure to change the grid appearance
if select calibration when in (which is by design not allowed) nothing happen, but if you then go to Reflection or Transmission mode the Calibration grid is displayed instead of normal grid
frequency calibration does not work for Extender mode
in the second step of transmission calibration "DUT and DET" and "RX and TX" are inversed for Extender/non Extender modes
app crash if trying to measure a cable length with the Extender at a frequency lower than 50 MHz
if “Back” pressed when in on-screen menu, the app goes back to Startup page instead of removing the on-screen menu
if “Back” pressed when in SM6ENG mode, the app goes back to Startup page with SM6ENG mode still active instead of stopping SM6ENG mode
if “Back” pressed when in Calibration mode, the app goes back to Startup page instead of canceling calibration. Because of this, sometimes a mixed mode is displayed (normal display with calibration grid)
when Calibrating, the big letter in the background is “A” instead of “R” for reflection mode
Version 0.9 (Mar 10th, 2014):
Bugs solved:
phase symbol not displayed in Smith Chart
in Smith Chart, Z is displayed on the button instead of |Z|
several stability issues fixed
transmission calibration lost if switching between loop and open calibration
app crash when using some devices without SD card
message that Wi-Fi is not available when running in the BlueStacks emulator
when trying to save data to a file, the filename is cropped in the upper part for some devices
Version 0.9.3 (Mar 25th, 2014):
change from Xs to |Xs| in VNA standard mode, as the value is always positive
Bluetooth auto-reconnect removed because of connection stability issues
prevent device going to sleep when the application is started
LOAD button is back In the Calibration panel
CANCEL button in Calibration selection window stays in calibration, not back to reflection/transmission
improved battery voltage display for miniVNA Pro when changing modes
more stability improvements
Bugs solved:
Phase symbol not displayed in Smith Chart
in Smith Chart, Z is displayed on the button instead of |Z|
more stability issues fixed
transmission calibration is lost if switching between loop and open calibration
app crash when using some devices without SD card
message that Wi-Fi is not available when running in the BlueStacks emulator
when trying to save data to a file, the filename is cropped in the upper part for some devices
app crash when using miniVNA standard in USB mode
phase symbol not displayed in Smith Chart
if number of calibration passes selection message box is displayed, pressing “RUN” will display an error
when saving the calibration data, the filename must start with 'a' in order to be able to save the file
sometimes duplicate files in file load dialog box
duplicate menu items if resetting configuration file
Smith Chart errors introduced in version 0.9.2, no continuous run, wrong display, etc.
network socket not saved
Java crash in Android 4.0.4 (ICS) when closing different windows
Version 0.9.4 (Jul 3rd, 2014):
miniVNA Tiny support
Sweeper functionality added to Generator mode
X-tal mode (both manual and auto) - EXPERIMENTAL
Some changes in the custom frequency window
Some changes in the Generator operation mode
Some graphical interface visibility improvements
Bugs solved:
Fix configuration file load crash
When you set the frequency in Extender Generator mode, the second output (not available for extender) is activated
Versions 0.9.4-1 – 0.9.4-9 – Intermediary versions, included changes described for version 0.9.5
Version 0.9.5 (Jul 22nd , 2015):
redesigned XLC mode
L and C measurements (experimental)
display firmware version, internal miniVNA temperature for Tiny mode in startup page
get battery voltage for Tiny (not yet functional in current firmware)
better handling of VNA type change
replace Wi-Fi by NET as you can connect over 3G/VPN too
add 23cm and 13cm bands in Tiny mode
bigger fonts for file list
better interpolation for calibration data to eliminate capture noise
change antenna bandwidth calculation (delta F) for SWR = 3 instead of SWR = 2
add configurable DDS clock
auto reconnect if returning from standby
new selectable feature: auto export data to a ZPLOT, S1P or CSV file after a reflection or transmission capture
some code cleanup
Bugs solved:
several bugs in Tiny mode
wrong VNA name for Tiny
no Phase scale for Tiny
do not force calibration if calibration data unavailable
fix the bug in continuous capture which generates wrong results
text in file export text input to big and not centered vertically
pressing any of the export buttons does not have any effect
in the exported files first two data lines contains invalid values
issues connection Tiny over USB (a big splash picture prevents starting the app)
DONE key does nothing when saving capture or calibration
"Invalid length CSV file " when importing a CSV file
memory leak/hang in miniVNA Standard mode capture
switch from miniVNA standard to Pro mode without any specific reason
Version 0.9.6 (Apr 15 , 2016):
improved live generator mode
redesigned GUI interface in Generator mode for Tiny/Extender/Standard miniVNAs
prevent pressing MODE and changing generator mode when generator is started.
new field in generator mode to display sweeper parameters
you can click on sweeper info area to edit sweeper configuration
some code cleanup
Bugs solved:
Bluetooth discovery issue on Android 6
cannot save data in Tiny mode with end freq > 2^31 ( 2147.483648MHz)
cannot load newly saved data in miniVNA Standard mode
fix cable mode for miniVNA Std and MetroVNA
in miniVNA standard mode the generator is not stopped if STOP button pressed.
broken sweeper in std mode
miniVNA Std in generator mode cannot direct entry the frequency
miniVNA Tiny Generator mode not functional
reset freq range to full before calibration
VNA picture does not change if you select miniVNA Std using the buttons
you cannot start the application in Offline mode as you are prompted in a loop to select Bluetooth device
crash in Generator mode (Tiny/STD/Extender modes) when clicking on MODE.
if application is started in normal generator mode, previously saved sweeper data is not loaded from the configuration file.
START button does not go orange when sweeper is started
in Tiny mode last generator frequency is not restored after application restart
Version 2.0 (Jan 24 , 2018):
full screen (immersive mode) with Android >= KitKat - navigation buttons are now hidden
fully redesigned XLCR mode with auto detection
make all saved files visible in Windows explorer immediately (no more Android restart required)
Progress Bar control changed, to be compliant with some non-standard Android devices
in the startup page, there is no more a virtual led. The color of the START button changes now based on connection status
second marker added, automatically calculating deltas
better response for marker movement
delta F display in minSWR window for SWR=2 and SWR=3
"Loss" button label changed to "Atten" in transmission mode
you can now set the attenuation scale manually in transmission mode (30, 60 or 90dB)
automatically calculate filter parameters in transmission mode (experimental)
a message is displayed if the calibration file is invalid when loaded
in transmission mode if you long press on Attn button, the two markers are automatically set for a user adjustable Loss (through a Seek Bar)
display pass number in the calibration status window
auto RL scale for Reflection mode too
In-app purchase if you like the application and you want to support further development
NOTE: The free version of the application contains and will contain all the features described in this user guide, with no limitations or restrictions. If you become a paid customer (bronze, silver, gold or platinum), is just a recognition of the fact that you like this application and you want to support future development
Bugs solved:
markers remaining on the screen in the right position even if you extend the screen
calibration broken in 0.9.6 (cannot use a new calibration)
files saved with version < 0.9.5-1 are loaded incorrectly
X-tal mode now works with miniVNA Standard too (use min Xs instead of Xs passing through 0 for miniVNA standard
Smith chart overlapping buttons if device display format is 4/3 (ex. 1024x768)
if miniVNA Standard and loading an* invalid calibration file for transmission, you are asking to do an Open instead of Loop calibration (Open calibration is not available in transmission mode for miniVNA Standard
errors if loading an incompatible file
bluevna_v2.0.pdf Bucharest, Jan 24, 2018 – © Dan Toma – YO3GGX – yo3ggx@gmail.com